Your graphics add a nice touch to my presentations and I recently used them for one of my all-hands meetings. Your toolbox adds professionalism to my slides. Instead of using standard clipart.
Claude Jones, Director of Engineer, @Walmartlabs, USA
Your graphics add a nice touch to my presentations and I recently used them for one of my all-hands meetings. Your toolbox adds professionalism to my slides. Instead of using standard clipart.
Claude Jones, Director of Engineer, @Walmartlabs, USA
I needed a fresh look at some of my slides. I've tried to find a way to create a paintbrush effect, to underline, accentuate, add some color and the handwritten markers were just the things. Very easy to use, easy to size, change the color. It was an affordable, perfect solution and I'm happy to recommend it.
Anonymous, US
The crisp, clean look of the graphics, and the fact that it allowed me to easily edit and change the colors to match the template was my main reason for purchasing them.
Brandie Jenkins, E-learning Developer, USA
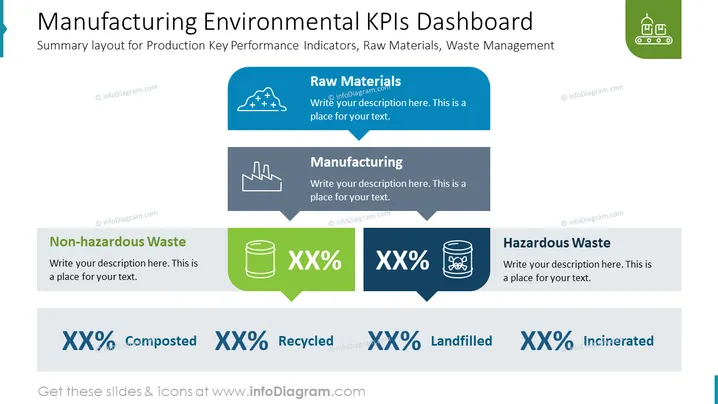
##Manufacturing Environmental KPIs Dashboard Slide
This explanatory slide illustrates the share of hazardous and non-hazardous waste in the manufacturing process. Also, you can discuss the overall flow of the production, starting from raw materials, through manufacturing, and ending with waste processing in numbers with this slide. Add your numbers, adjust colors to match your branding, and you are set up.
Manufacturing Environmental KPIs Dashboard Summary layout for Production Key Performance Indicators, Raw Materials, Waste Management
##What Does This Manufacturing Environmental KPIs Dashboard Slide Include?
This Manufacturing Environmental KPIs Dashboard Slide is a part of our Environmental Sustainability Policy ESG Report PPT Template.


