Financial Decks
Visualize your results with ease
Main Components of Data Science Diagram
with Strategy, Engineering, Analysis, Visualization
from deck
Data Science Analytics Outline Graphics Template (PPT Icons)
Info
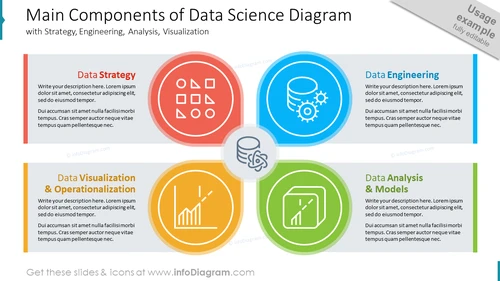
Main Components of Data Science Diagram
Slide Content:
The PowerPoint slide presents four core aspects of data science: Data Strategy, Data Engineering, Data Analysis & Models, and Data Visualization & Operationalization. Data Strategy involves planning and governance, essential for aligning data-related activities with business objectives. Data Engineering focuses on the construction and maintenance of data pipelines for reliable data flow. Data Analysis & Models emphasize the extraction of insights and the construction of predictive models from data. Lastly, Data Visualization & Operationalization highlights the importance of presenting data findings in an understandable format and putting them into practice.
Graphical Look:
- Four circular icons with different colors and symbols representing each data science component.
- The color palette includes red, blue, yellow, and green, each corresponding to one of the four main components.
- Each section has a title in a colored sidebar aligned with the icon's color.
Overall, the slide has a clean and professional look with a clear structure that uses color coding to differentiate between the various components. The icons are simple yet effectively convey the essence of each data science aspect.
Use Cases:
- Introduction to data science concepts in educational settings or workshops.
- Explaining a company's data science framework during internal team meetings.
- Pitching a data science strategy to potential investors or stakeholders.
- Providing an overview of a data science project's methodology in client presentations.


