Your graphics add a nice touch to my presentations and I recently used them for one of my all-hands meetings. Your toolbox adds professionalism to my slides. Instead of using standard clipart.
Claude Jones, Director of Engineer, @Walmartlabs, USA
Your graphics add a nice touch to my presentations and I recently used them for one of my all-hands meetings. Your toolbox adds professionalism to my slides. Instead of using standard clipart.
Claude Jones, Director of Engineer, @Walmartlabs, USA
I needed a fresh look at some of my slides. I've tried to find a way to create a paintbrush effect, to underline, accentuate, add some color and the handwritten markers were just the things. Very easy to use, easy to size, change the color. It was an affordable, perfect solution and I'm happy to recommend it.
Anonymous, US
The crisp, clean look of the graphics, and the fact that it allowed me to easily edit and change the colors to match the template was my main reason for purchasing them.
Brandie Jenkins, E-learning Developer, USA
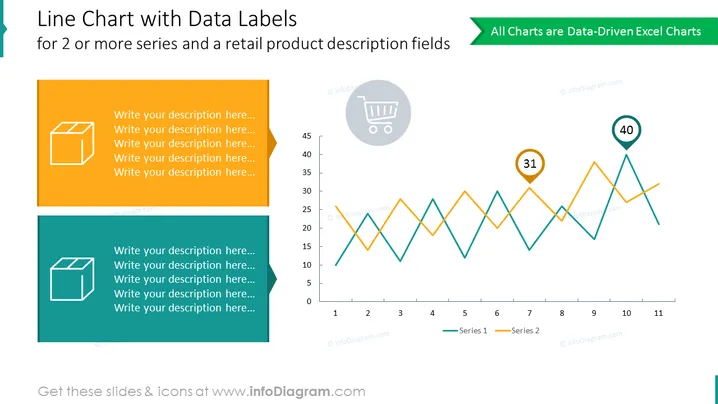
##Line Chart With Data Labels Placing Product Description Fields Template
This is a 2 variables line chart presenting data against each other in one diagram. Use this Excel data-driven chart to mark critical achievements with colorful numeric markers and add specific descriptions to the text containers on the side. Compare data easily, thanks to the contrasting colors of the chart lines and slide graphics.
##What Does This Line Chart With Data Labels Placing Product Description Fields Template Include?
This Line Chart With Data Labels Placing Product Description Fields Template is a part of our Line Chart Data-driven Graphics PPT Template.


