Your graphics add a nice touch to my presentations and I recently used them for one of my all-hands meetings. Your toolbox adds professionalism to my slides. Instead of using standard clipart.
Claude Jones, Director of Engineer, @Walmartlabs, USA
Your graphics add a nice touch to my presentations and I recently used them for one of my all-hands meetings. Your toolbox adds professionalism to my slides. Instead of using standard clipart.
Claude Jones, Director of Engineer, @Walmartlabs, USA
I needed a fresh look at some of my slides. I've tried to find a way to create a paintbrush effect, to underline, accentuate, add some color and the handwritten markers were just the things. Very easy to use, easy to size, change the color. It was an affordable, perfect solution and I'm happy to recommend it.
Anonymous, US
The crisp, clean look of the graphics, and the fact that it allowed me to easily edit and change the colors to match the template was my main reason for purchasing them.
Brandie Jenkins, E-learning Developer, USA
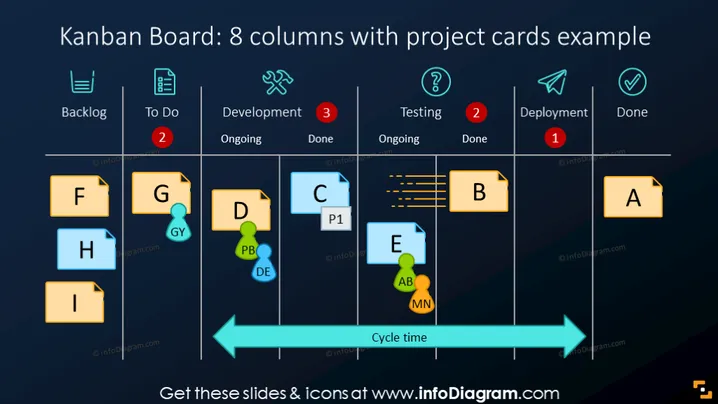
This slide depicts a Kanban board with 8 columns, categorizing project tasks under Backlog, To Do, Development (Ongoing and Done), Testing (Ongoing and Done), Deployment, and Done. Each column contains project cards labeled with letters and some with additional markers such as priority indicators or person avatars. The Kanban board demonstrates how tasks move from left to right, symbolizing workflow progression. Tasks in the Backlog are ready to be picked, To Do indicates tasks that are up next, Development and Testing show work in progress with a distinction between ongoing and completed tasks, Deployment is for pending releases, and Done represents completed work. A cycle time arrow at the bottom highlights the time taken for tasks to complete the process.
The slide has a sleek and modern design with a clear visual hierarchy, and its use of color coding and icons makes the information accessible at a glance.


