Your graphics add a nice touch to my presentations and I recently used them for one of my all-hands meetings. Your toolbox adds professionalism to my slides. Instead of using standard clipart.
Claude Jones, Director of Engineer, @Walmartlabs, USA
Your graphics add a nice touch to my presentations and I recently used them for one of my all-hands meetings. Your toolbox adds professionalism to my slides. Instead of using standard clipart.
Claude Jones, Director of Engineer, @Walmartlabs, USA
I needed a fresh look at some of my slides. I've tried to find a way to create a paintbrush effect, to underline, accentuate, add some color and the handwritten markers were just the things. Very easy to use, easy to size, change the color. It was an affordable, perfect solution and I'm happy to recommend it.
Anonymous, US
The crisp, clean look of the graphics, and the fact that it allowed me to easily edit and change the colors to match the template was my main reason for purchasing them.
Brandie Jenkins, E-learning Developer, USA
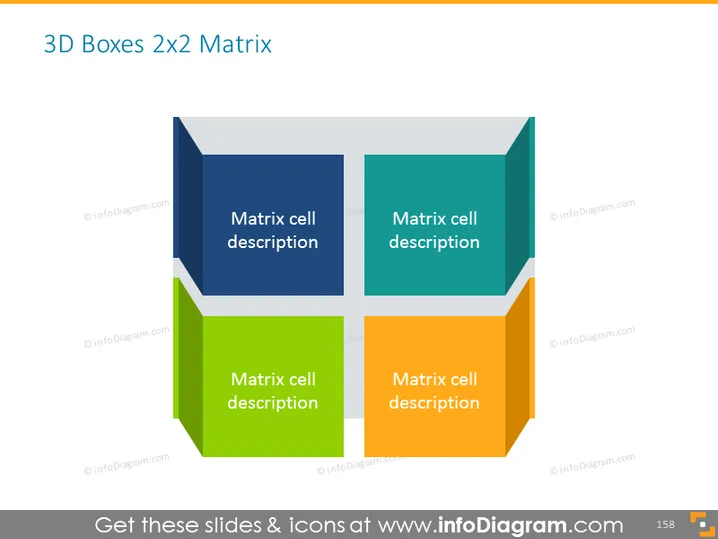
The slide presents a 3D Boxes 2x2 matrix, a commonly used framework for categorizing information into four distinct quadrants. Each box, visualized in a different color (blue, teal, green, and orange), contains the placeholder text "Matrix cell description," indicating where a presenter should include details relevant to that quadrant. This setup is useful for demonstrating relationships, comparisons, or strategic positioning of concepts, where each quadrant could represent a different dimension of analysis.
The slide has a minimalistic and clean design, with a professional look achieved through the use of color-blocking and shadow effects to create the 3D appearance. The overall effect is modern and engaging, helping to draw attention to each quadrant.


