Your graphics add a nice touch to my presentations and I recently used them for one of my all-hands meetings. Your toolbox adds professionalism to my slides. Instead of using standard clipart.
Claude Jones, Director of Engineer, @Walmartlabs, USA
Your graphics add a nice touch to my presentations and I recently used them for one of my all-hands meetings. Your toolbox adds professionalism to my slides. Instead of using standard clipart.
Claude Jones, Director of Engineer, @Walmartlabs, USA
I needed a fresh look at some of my slides. I've tried to find a way to create a paintbrush effect, to underline, accentuate, add some color and the handwritten markers were just the things. Very easy to use, easy to size, change the color. It was an affordable, perfect solution and I'm happy to recommend it.
Anonymous, US
The crisp, clean look of the graphics, and the fact that it allowed me to easily edit and change the colors to match the template was my main reason for purchasing them.
Brandie Jenkins, E-learning Developer, USA
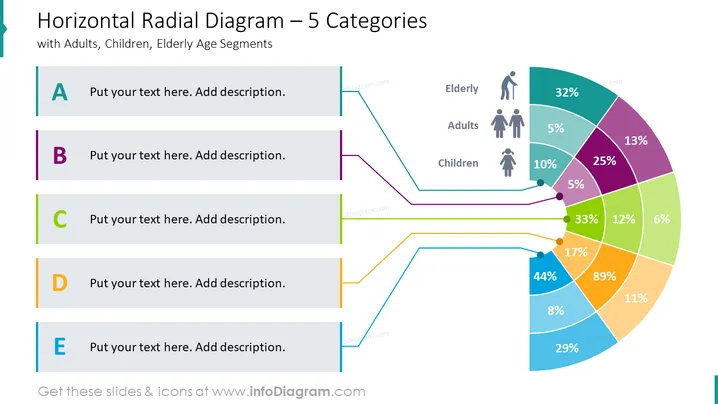
##Horizontal Radial Diagram Slide A horizontal radial diagram is a type of diagram used to visualize data in a half circle. It’s an effective way to compare multiple variables and show the relationship between them. The circles are divided into segments that represent each category, and their relative percentages indicate how the variables are connected. This type of diagram is useful for displaying information about different aspects of different entities, in this case, demographics. It can also be used to compare several entities at once, allowing you to easily identify patterns and trends within the data. With its clear visuals, horizontal radial diagrams make it easier to identify correlations and create meaningful slides from your analysis.
##What Does This Horizontal Radial Diagram Slide Include?
This Horizontal Radial Diagram slide is a part of our Radial Fan Chart PowerPoint Template.


