Your graphics add a nice touch to my presentations and I recently used them for one of my all-hands meetings. Your toolbox adds professionalism to my slides. Instead of using standard clipart.
Claude Jones, Director of Engineer, @Walmartlabs, USA
Your graphics add a nice touch to my presentations and I recently used them for one of my all-hands meetings. Your toolbox adds professionalism to my slides. Instead of using standard clipart.
Claude Jones, Director of Engineer, @Walmartlabs, USA
I needed a fresh look at some of my slides. I've tried to find a way to create a paintbrush effect, to underline, accentuate, add some color and the handwritten markers were just the things. Very easy to use, easy to size, change the color. It was an affordable, perfect solution and I'm happy to recommend it.
Anonymous, US
The crisp, clean look of the graphics, and the fact that it allowed me to easily edit and change the colors to match the template was my main reason for purchasing them.
Brandie Jenkins, E-learning Developer, USA
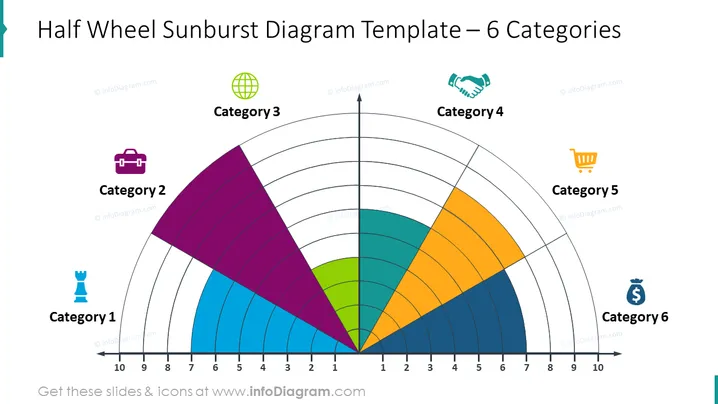
##Half Wheel Sunburst Diagram Slide Half-wheel sunburst diagrams are made up of circles and radial lines. The circle part represents the relative category and size of the data points, while the radial lines display the different levels of hierarchy in the data. Each segmented part of the circle represents one data point or category, with bigger circles representing larger amounts of data points. (more colorful the bigger/higher) The half-wheel sunburst diagram is pretty versatile so it can be used to visualize spending, investment, budgeting, organizational hierarchies, or any other hierarchical data structure and simple comparisons.
##What Does This Half-Wheel Sunburst Diagram Slide Include?
This Consumer Demographics Fan Diagram slide is a part of our Radial Fan Chart PowerPoint Template.


