Your graphics add a nice touch to my presentations and I recently used them for one of my all-hands meetings. Your toolbox adds professionalism to my slides. Instead of using standard clipart.
Claude Jones, Director of Engineer, @Walmartlabs, USA
Your graphics add a nice touch to my presentations and I recently used them for one of my all-hands meetings. Your toolbox adds professionalism to my slides. Instead of using standard clipart.
Claude Jones, Director of Engineer, @Walmartlabs, USA
I needed a fresh look at some of my slides. I've tried to find a way to create a paintbrush effect, to underline, accentuate, add some color and the handwritten markers were just the things. Very easy to use, easy to size, change the color. It was an affordable, perfect solution and I'm happy to recommend it.
Anonymous, US
The crisp, clean look of the graphics, and the fact that it allowed me to easily edit and change the colors to match the template was my main reason for purchasing them.
Brandie Jenkins, E-learning Developer, USA
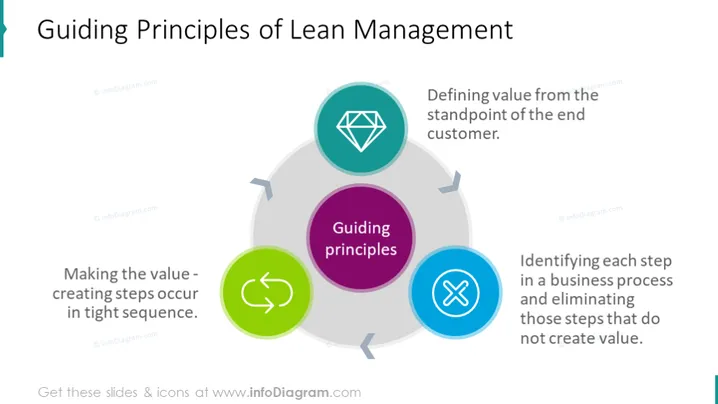
##Guide Management Principles Illustrated With Cycle Chart Diagram
Use this slide to illustrate three principles of lean management: defining a value, creating the value, and eliminating the steps that don't make the value. Illustrate the relationship between each element and highlight their meaning with self-explanatory icons. Learn about lean project management on Wikipedia.
##What Does This Guide Management Principles Illustrated With Cycle Chart Diagram Include?
This Guide Management Principles Illustrated With Cycle Chart Diagram is a part of our Lean Management Presentation Diagrams PPT Template.


