Your graphics add a nice touch to my presentations and I recently used them for one of my all-hands meetings. Your toolbox adds professionalism to my slides. Instead of using standard clipart.
Claude Jones, Director of Engineer, @Walmartlabs, USA
Your graphics add a nice touch to my presentations and I recently used them for one of my all-hands meetings. Your toolbox adds professionalism to my slides. Instead of using standard clipart.
Claude Jones, Director of Engineer, @Walmartlabs, USA
I needed a fresh look at some of my slides. I've tried to find a way to create a paintbrush effect, to underline, accentuate, add some color and the handwritten markers were just the things. Very easy to use, easy to size, change the color. It was an affordable, perfect solution and I'm happy to recommend it.
Anonymous, US
The crisp, clean look of the graphics, and the fact that it allowed me to easily edit and change the colors to match the template was my main reason for purchasing them.
Brandie Jenkins, E-learning Developer, USA
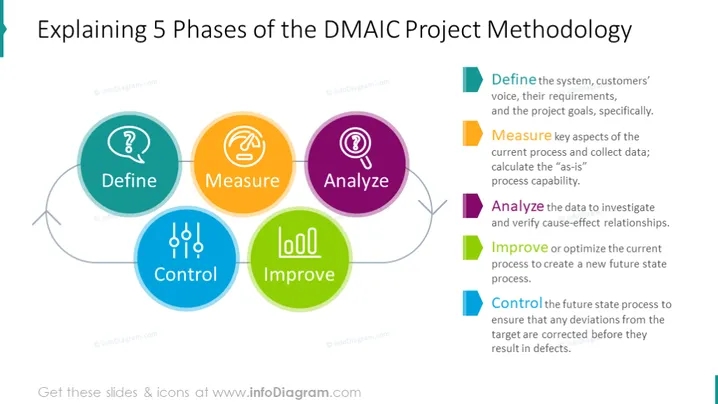
##Five Phases of the DMAIC Methodology Shown With a Diagram and Description Slide
This is a PowerPoint diagram explaining 5 phases of the DMAIC project methodology. It illustrates the flow between all stages: define, measure, analyze, improve, and control. Add a description to each phase and inform your audience about specific actions taken in your company. Learn about DMAIC and six sigma on Wikipedia.
##What Does This Five Phases of the DMAIC Methodology Shown With a Diagram and Description Slide Include?
This Five Phases of the DMAIC Methodology Shown With a Diagram and Description Slide is a part of our Six Sigma Presentation DMAIC Diagrams PPT Template.


