Your graphics add a nice touch to my presentations and I recently used them for one of my all-hands meetings. Your toolbox adds professionalism to my slides. Instead of using standard clipart.
Claude Jones, Director of Engineer, @Walmartlabs, USA
Your graphics add a nice touch to my presentations and I recently used them for one of my all-hands meetings. Your toolbox adds professionalism to my slides. Instead of using standard clipart.
Claude Jones, Director of Engineer, @Walmartlabs, USA
I needed a fresh look at some of my slides. I've tried to find a way to create a paintbrush effect, to underline, accentuate, add some color and the handwritten markers were just the things. Very easy to use, easy to size, change the color. It was an affordable, perfect solution and I'm happy to recommend it.
Anonymous, US
The crisp, clean look of the graphics, and the fact that it allowed me to easily edit and change the colors to match the template was my main reason for purchasing them.
Brandie Jenkins, E-learning Developer, USA
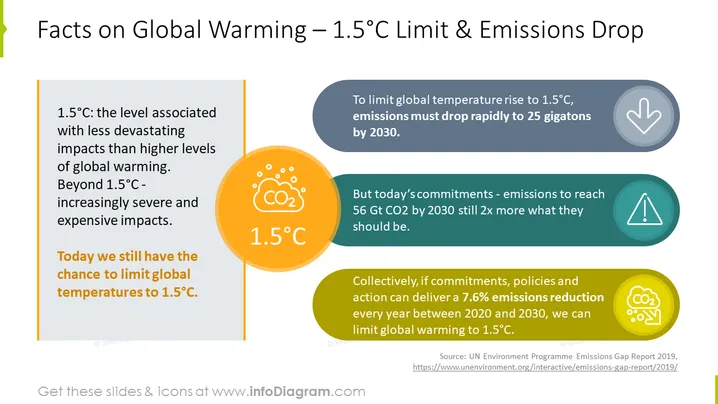
The slide details crucial information about the global effort to limit temperature rise to 1.5°C and how current emissions targets are inadequate. The 1.5°C target is identified as less catastrophic than higher temperature increases, which could cause progressively severe and costlier effects. It mentions that there is still a possibility to cap temperature increases to 1.5°C but points out that current commitments will result in double the emissions by 2030 than what is necessary. Lastly, it asserts that with collective actions and policies, a 7.6% annual reduction in emissions from 2020 to 2030 can help achieve the 1.5°C goal.
The slide has a clean and modern appearance, with a balance of text and visual elements. The usage of bright colors and distinct icons draws the viewer's attention to key points.


