Financial Decks
Visualize your results with ease
Task timeline over a year
from deck
Web Analytics Report Charts (PPT Template)
Info
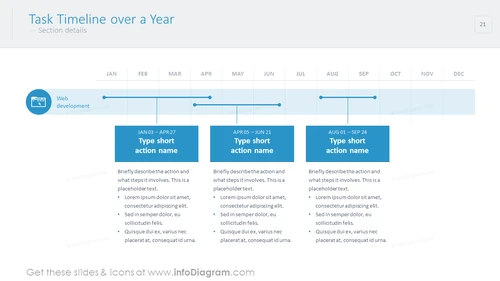
Task Timeline Over a Year Diagram
Minimalistic PowerPoint timeline template for planning tasks over the year. Use this slide to mark your long-term and short-term actions and explain them in detailed descriptions. This slide is versatile. It can be used for past achievements and future initiatives according to your needs.
What Does This Task Timeline Over a Year Diagram Include?
- an editable monochromatic monthly timeline with an icon
- graphic markers for long-term and short-term actions
- 3 text placeholders with bold title areas for your descriptions
- a flat icon of a calendar
This Task Timeline Over a Year Diagram is a part of our Web Analytics Report Charts PPT Template.


