Your graphics add a nice touch to my presentations and I recently used them for one of my all-hands meetings. Your toolbox adds professionalism to my slides. Instead of using standard clipart.
Claude Jones, Director of Engineer, @Walmartlabs, USA
Your graphics add a nice touch to my presentations and I recently used them for one of my all-hands meetings. Your toolbox adds professionalism to my slides. Instead of using standard clipart.
Claude Jones, Director of Engineer, @Walmartlabs, USA
I needed a fresh look at some of my slides. I've tried to find a way to create a paintbrush effect, to underline, accentuate, add some color and the handwritten markers were just the things. Very easy to use, easy to size, change the color. It was an affordable, perfect solution and I'm happy to recommend it.
Anonymous, US
The crisp, clean look of the graphics, and the fact that it allowed me to easily edit and change the colors to match the template was my main reason for purchasing them.
Brandie Jenkins, E-learning Developer, USA
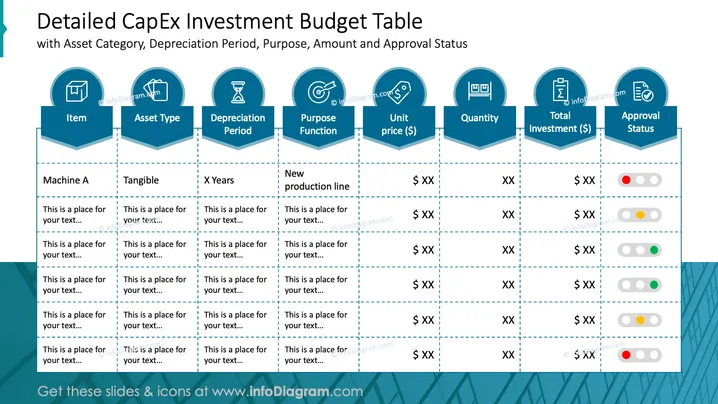
The slide titled "Detailed CapEx Investment Budget Table" breaks down various components of a capital expenditure budget. It includes classifications such as 'Item', 'Asset Type', which indicates whether an asset is tangible or intangible, 'Depreciation Period,' which specifies the time frame for the asset's value reduction, 'Purpose Function' that outlines the use of the investment, 'Unit price' showing individual asset cost, 'Quantity' of assets to be purchased, 'Total Investment' indicating the overall financial commitment, and 'Approval Status' using a color-coded system to signal the stage of approval.
The overall look of the slide is designed for clarity and efficiency, with a focus on data presentation. The use of iconic imagery helps to quickly identify categories and statuses at a glance.


