Financial Decks
Visualize your results with ease
Example of the horizontal decision tree with data values
from deck
Decision Tree Diagram Charts (PPT Template)
Info
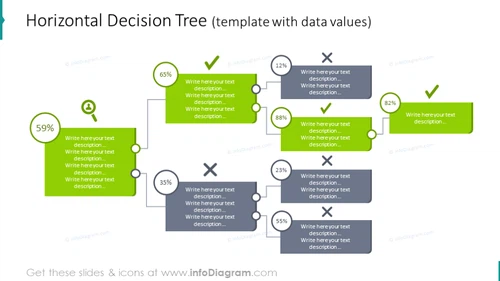
Horizontal Decision Tree (template with data values)
Slide Content
The slide represents a Horizontal Decision Tree, a visual tool often used to display a series of choices and their outcomes. The template includes percentages that likely represent statistical probabilities or data values associated with each decision path. It begins with a 59% marker, followed by two branches: one with 65% leading to a positive outcome and the other with 35% leading to a negative outcome. Further branching shows an 88% positive path alongside an opposite 12% negative outcome, as well as a 55% positive branch opposed to a negative 23% outcome. Each node offers space to write a detailed description, allowing the presenter to expand upon what each percentage or decision represents.
Graphical Look
- A large title at the top in bold, dark text.
- A linear sequence of green and gray circles connected by lines, representing the decision points of the tree.
- Each decision point has a corresponding percentage in a colored circle, indicating an outcome or choice probability.
- Green checkmarks symbolize positive or favorable outcomes, while red X's denote negative or unfavorable outcomes.
- Text fields adjacent to each decision point for descriptions or notes.
- Visual elements like circles and connecting lines are flat with slight shadow effects for depth.
The slide's overall appearance is clean and modern, using a minimal color palette to draw attention to specific elements such as the decision points and outcomes. The design is symmetrical, with branches on either side of the main decision path, creating a balanced visual flow.
Use Cases
- Illustrating decision outcomes and probabilities in a business strategy presentation.
- Visualizing paths in project management scenarios, showcasing potential risks and success rates.
- Analyzing and presenting market research data, comparing various consumer choices or product paths.
- Teaching decision-making processes in an educational or training setting, allowing for the explanation of branching decisions and their consequences.


