Your graphics add a nice touch to my presentations and I recently used them for one of my all-hands meetings. Your toolbox adds professionalism to my slides. Instead of using standard clipart.
Claude Jones, Director of Engineer, @Walmartlabs, USA
Your graphics add a nice touch to my presentations and I recently used them for one of my all-hands meetings. Your toolbox adds professionalism to my slides. Instead of using standard clipart.
Claude Jones, Director of Engineer, @Walmartlabs, USA
I needed a fresh look at some of my slides. I've tried to find a way to create a paintbrush effect, to underline, accentuate, add some color and the handwritten markers were just the things. Very easy to use, easy to size, change the color. It was an affordable, perfect solution and I'm happy to recommend it.
Anonymous, US
The crisp, clean look of the graphics, and the fact that it allowed me to easily edit and change the colors to match the template was my main reason for purchasing them.
Brandie Jenkins, E-learning Developer, USA
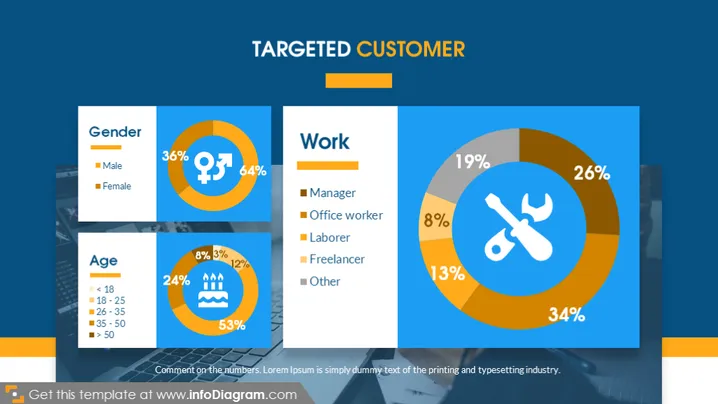
This PowerPoint slide is presenting demographic information about a business's targeted customers, broken down by gender, age, and type of work. The "Gender" section shows a 64% male and 36% female distribution, suggesting the product or service is more frequently used by males. The "Age" section indicates the largest customer group is between 26-35 years old, accounting for 53%, followed by those aged 18-25 (24%), suggesting a young adult demographic. The "Work" category is broken down into Manager (26%), Office Worker (19%), Laborer (13%), Freelancer (34%), and Other (8%), implying a significant freelance customer base.
The overall look of the slide is professional and clear, using a color scheme that differentiates demographic segments effectively. The pie charts serve as visual focal points, simultaneously conveying data while maintaining overall aesthetic coherence.


