BSC Execution Dashboard – Learning and Growth Perspective
Slide Content
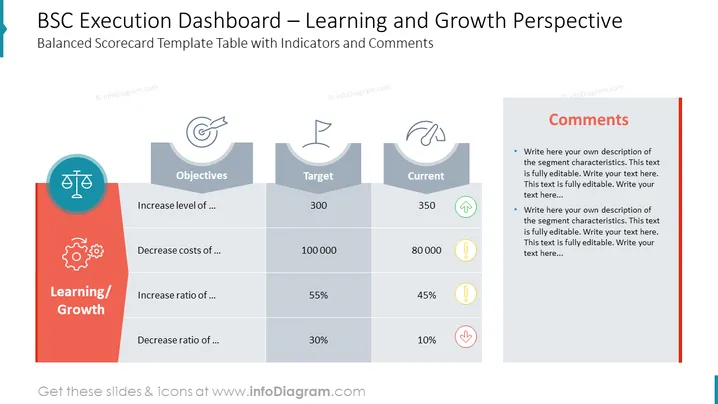
The slide titled "BSC Execution Dashboard – Learning and Growth Perspective" shows a balanced scorecard template focusing on learning and growth metrics. It lists objectives like 'Increase level of...' and 'Decrease costs of...', with corresponding 'Target' and 'Current' values, such as 300 target vs. 350 current for the first objective, indicating performance against goals. Additionally, there are sections for 'Increase ratio of...' and 'Decrease ratio of...', each with their own targets and current values. Next to each metric, there are simple indicators: green upward arrows for positive performance, yellow warning symbols for caution, and red downward arrows for negative trends, driving the visual feedback mechanism for quick assessment.
Graphical Look
- The slide has a clear and structured layout with a red sidebar on the left featuring the words "Learning/Growth" and corresponding icons.
- Four main column headers are displayed in a lighter grey shade with icons and text: "Objectives", "Target", "Current", and "Comments".
- There's a large title at the top in bold black font alongside a dark grey banner where the slide title is located.
- Below the column headers, the rows alternate in shading between light grey and white for better readability.
- Icons alongside the text in the rows: Scales for 'Increase level of...', Gears for 'Decrease costs of...', and so on, are employed to symbolize different objectives.
- Performance indicators next to the current values include green up arrows, yellow caution symbols, and red down arrows to signify performance status relative to targets.
- The 'Comments' column to the right has a vertical red bar, and the text placeholders invite users to add their own notes.
The slide employs a professional color palette with blue, grey, and red accents to visually segment information. Iconographic elements combined with performance indicators create an intuitive and easy-to-digest performance overview.
Use Cases ## BSC Execution Dashboard – Learning and Growth Perspective
Slide Content
The slide is a Balanced Scorecard (BSC) Execution Dashboard with a focus on the Learning and Growth Perspective. It comprises a table with four main columns titled "Objectives", "Target", "Current", and "Comments". Each row corresponds to an objective such as "Increase level of..." or "Decrease costs of...", with concrete numerical targets and current performance indicators. Performance against each objective is visually represented by directional arrows or warning symbols, suggesting a clear method for tracking organizational development and growth-related goals.
Graphical Look
- The title "BSC Execution Dashboard – Learning and Growth Perspective" is prominently displayed at the top in a dark grey, bold font.
- A red vertical bar on the left side contains the category label "Learning/Growth", enhancing theme recognition.
- The main part of the slide has a table with slightly rounded corners and a subtle shadow, providing depth.
- Each column in the table has a unique icon that corresponds to the column's theme, for example, a dartboard for "Objectives".
- The row labels use icons as well, such as scales to represent balance for the "Increase level of..." objective.
- Data in the table is accompanied by colored symbols indicating performance, such as a green upward arrow for positive progress.
- A distinct comment section on the right has bullet points in a red-outlined text box, ready for personalized input.
The slide is designed with a clean and corporate aesthetic, utilizing a mix of sharp and rounded corners, a clear demarcation of sections through color, and visual aids like icons and arrows to summarize the data efficiently.
Use Cases
- Quarterly or annual business reviews to report on the progress of educational and developmental initiatives.
- Strategy meetings where learning and growth targets are discussed and monitored for alignment with overall organizational goals.
- Performance management presentations where individual or departmental achievements in terms of skills and capabilities are evaluated.
- Board meetings to ## BSC Execution Dashboard – Learning and Growth Perspective
Slide Content
The slide represents a Balanced Scorecard (BSC) Execution Dashboard aimed at the Learning and Growth Perspective. It features a structured table with columns for tracking 'Objectives,' 'Target,' and 'Current' performance, specifically focusing on indicators such as increasing levels or decreasing costs and ratios. Performance indicators, including green up arrows (improvement), yellow caution exclamation marks (potential issues), and red down arrows (decline), offer a quick visual reference for the statuses of the respective targets, enabling easy interpretation and analysis of progress.
Graphical Look
- Bold slide title "BSC Execution Dashboard – Learning and Growth Perspective" centered at the top in a dark font.
- The left side features a vertical red stripe labeled "Learning/Growth" with associated symbols like a scale and gears.
- A table with columns labeled "Objectives," "Target," "Current," each accompanied by a unique icon such as a bullseye for objectives.
- Rows vary in background shade between light and dark grey, improving readability and distinction between entries.
- Performance indicator icons (up arrow, caution sign, down arrow) are placed next to current performance figures.
- A comment section with a red sidebar includes bullet points and editable text areas.
The slide layout is organized, with a professional color scheme combining shades of grey, blue, and red, designed for clarity and focus on content. Icons and performance indicators are used effectively for quick visual interpretation.
Use Cases
- Tracking and presenting organizational learning and growth metrics in a management meeting.
- Reviewing departmental or team performance in terms of skill development and innovation during strategy sessions.
- Providing a visual update on educational initiatives during staff or stakeholder briefings.
- Facilitating discussions on areas for improvement and success recognition in executive reviews or board meetings.