Financial Decks
Visualize your results with ease
Big data toolbox content
from deck
Big Data Presentation Outline Diagrams (PPT Template)
Info
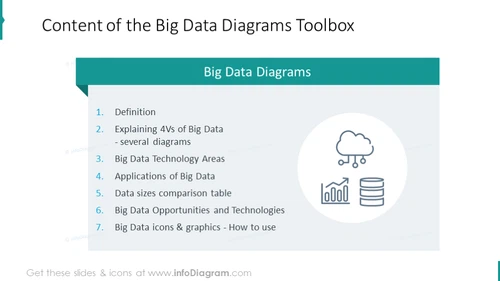
Content of the Big Data Diagrams Toolbox
Slide Content
The slide is titled "Big Data Diagrams" and outlines the contents of a toolbox designed for presenting big data concepts. The topics covered include: 1) Definition – presumably the basic concepts of big data, 2) Explaining 4Vs of Big Data – covering the four key characteristics: volume, velocity, variety, and veracity, 3) Big Data Technology Areas – likely an overview of technical domains within big data, 4) Applications of Big Data – examples where big data can be utilized, 5) Data sizes comparison table – a visual comparison of different data sizes, 6) Big Data Opportunities and Technologies – potential opportunities and relevant technologies in the field, 7) Big Data icons & graphics - How to use – guidance on utilizing icons and graphics for big data presentations.
Graphical Look
- The slide header features a dark teal ribbon with the slide title text in white.
- A large, bold, teal-colored title "Big Data Diagrams" is centered in the middle of the slide.
- There is a numbered list on the left side, with each item denoting a different component of the Big Data Diagrams Toolbox.
- Each list item is a different shade of teal or blue, creating a gradient effect.
- To the right, there is a circular graphic with a cloud and data-related symbols such as a graph, database, and gear, encapsulated within a light circle.
- The background of the slide is a clean, white color.
The overall look of the slide is clean and professional, with a color scheme dominated by shades of teal and blue. The use of a gradient in the list items adds visual interest and makes the slide aesthetically pleasing.
Use Cases
- Introducing a team to the basic concepts and tools related to big data in a corporate training session.
- Kicking off a project meeting where big data will play a central role, offering a visual roadmap of the topics to be discussed.
- Presenting an educational workshop on big data, where different modules or sections are clearly outlined to guide learners.
- Starting a sales or consulting presentation to a potential client interested in big data solutions, showcasing the breadth of analytical tools and concepts available.


