Your graphics add a nice touch to my presentations and I recently used them for one of my all-hands meetings. Your toolbox adds professionalism to my slides. Instead of using standard clipart.
Claude Jones, Director of Engineer, @Walmartlabs, USA
Your graphics add a nice touch to my presentations and I recently used them for one of my all-hands meetings. Your toolbox adds professionalism to my slides. Instead of using standard clipart.
Claude Jones, Director of Engineer, @Walmartlabs, USA
I needed a fresh look at some of my slides. I've tried to find a way to create a paintbrush effect, to underline, accentuate, add some color and the handwritten markers were just the things. Very easy to use, easy to size, change the color. It was an affordable, perfect solution and I'm happy to recommend it.
Anonymous, US
The crisp, clean look of the graphics, and the fact that it allowed me to easily edit and change the colors to match the template was my main reason for purchasing them.
Brandie Jenkins, E-learning Developer, USA
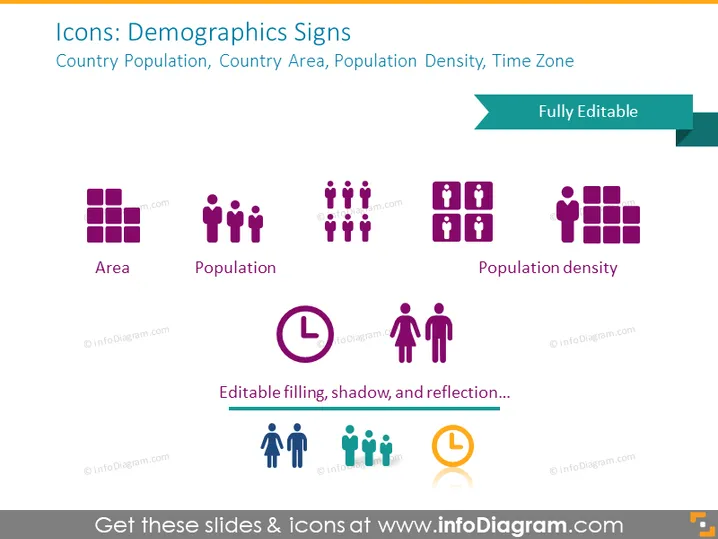
The slide titled "Icons: Demographics Signs" introduces a set of graphical icons related to demographics and statistical representations. These icons signify concepts like country population, country area, population density, and time zone. The 'Area' icon depicts a grid structure, representing geographical plotting or zoning; the 'Population' icon illustrates a group of people, symbolizing a collective of individuals; 'Population density' combines the people icon with grid elements, denoting the concentration of individuals in a given area; and 'Time Zone' is not shown but typically would involve clock imagery to represent different time divisions across the globe.
The slide presents a clean design with good use of space and color contrast. The icons are distinct and easily identifiable, aiding in quick communication of demographic concepts.


