Cover and narrative setup

Deck preview
This template does not have a dedicated before/after case study, so we show the strongest slides from the actual deck instead.
Cover and narrative setup
Core structure and talking points
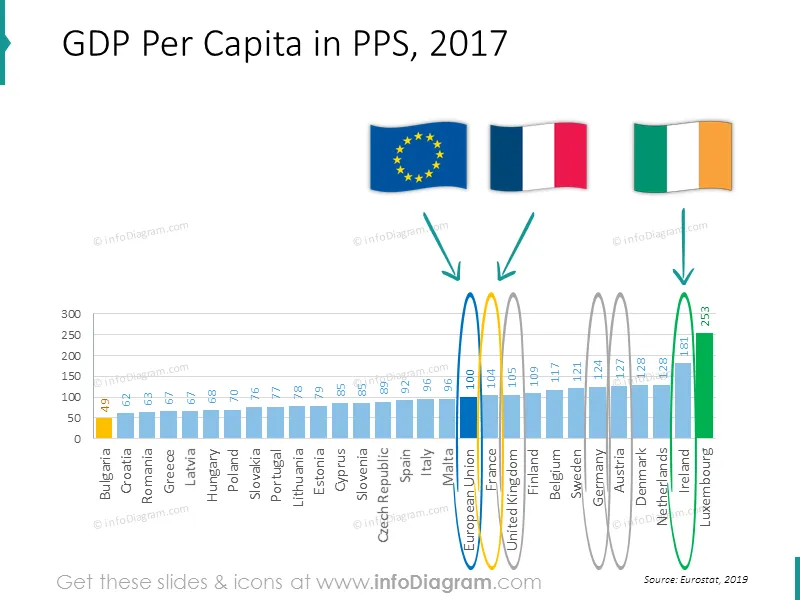
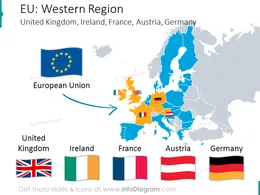
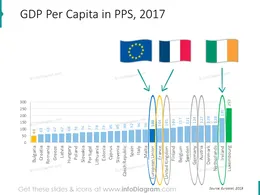
Polished visual slide from the deck
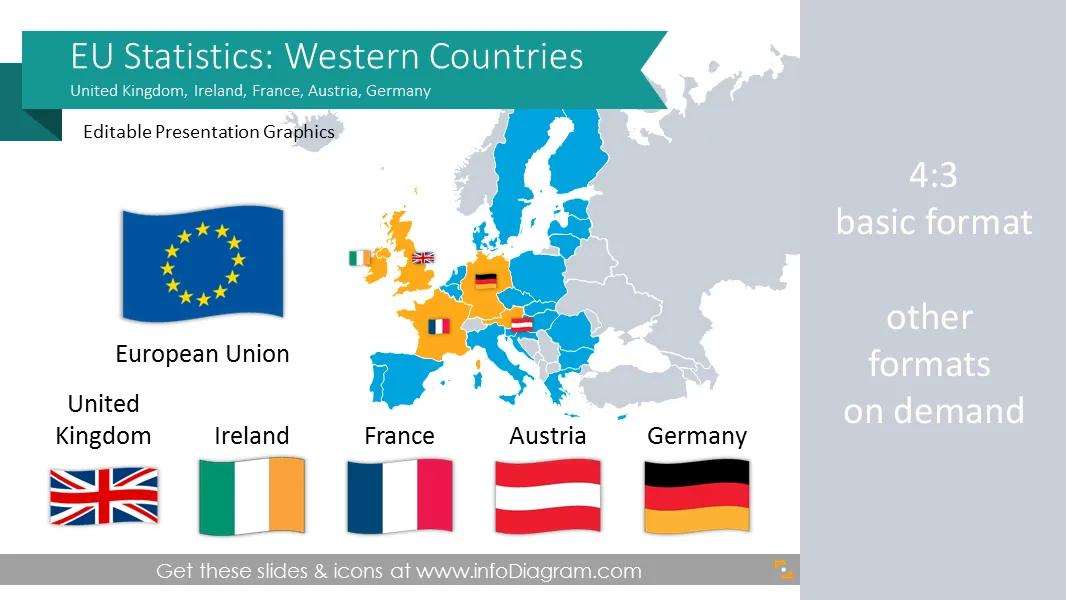
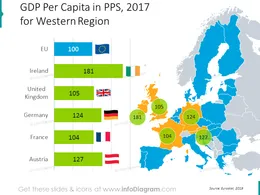
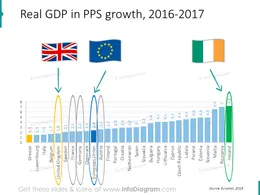
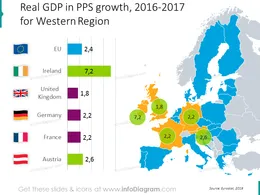
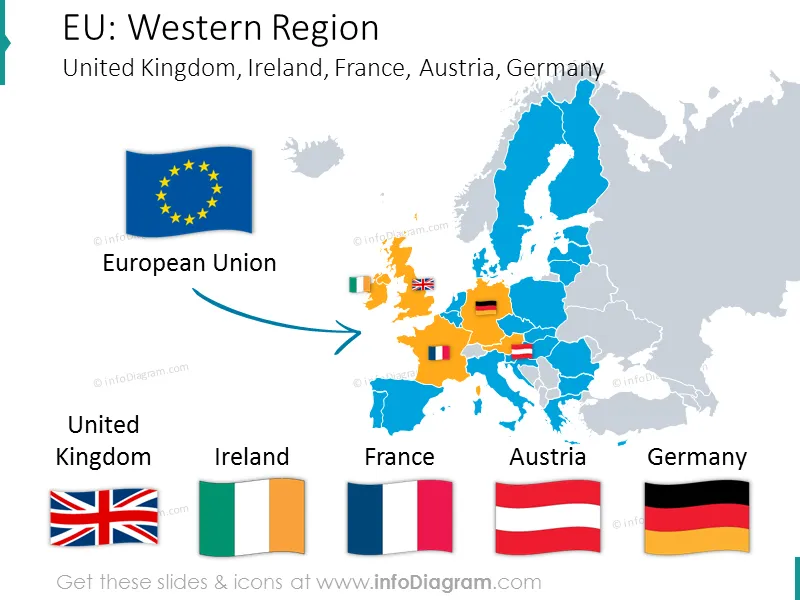
Editable visualizations of main macroeconomic statistics of France, Germany, United Kingdom, Ireland, Austria
Comparing European Union average with Western EU countries (based on official Eurostat data)
Basic country data:
Fully editable vector shapes by using built-in PowerPoint tools, including
See editing demonstration in our HowTo Videos.
Your graphics add a nice touch to my presentations and I recently used them for one of my all-hands meetings. Your toolbox adds professionalism to my slides. Instead of using standard clipart.
Claude Jones, Director of Engineer, @Walmartlabs, USA
I needed a fresh look at some of my slides. I've tried to find a way to create a paintbrush effect, to underline, accentuate, add some color and the handwritten markers were just the things. Very easy to use, easy to size, change the color. It was an affordable, perfect solution and I'm happy to recommend it.
Anonymous, US
The crisp, clean look of the graphics, and the fact that it allowed me to easily edit and change the colors to match the template was my main reason for purchasing them.
Brandie Jenkins, E-learning Developer, USA


You may also need