Your graphics add a nice touch to my presentations and I recently used them for one of my all-hands meetings. Your toolbox adds professionalism to my slides. Instead of using standard clipart.
Claude Jones, Director of Engineer, @Walmartlabs, USA
Your graphics add a nice touch to my presentations and I recently used them for one of my all-hands meetings. Your toolbox adds professionalism to my slides. Instead of using standard clipart.
Claude Jones, Director of Engineer, @Walmartlabs, USA
I needed a fresh look at some of my slides. I've tried to find a way to create a paintbrush effect, to underline, accentuate, add some color and the handwritten markers were just the things. Very easy to use, easy to size, change the color. It was an affordable, perfect solution and I'm happy to recommend it.
Anonymous, US
The crisp, clean look of the graphics, and the fact that it allowed me to easily edit and change the colors to match the template was my main reason for purchasing them.
Brandie Jenkins, E-learning Developer, USA
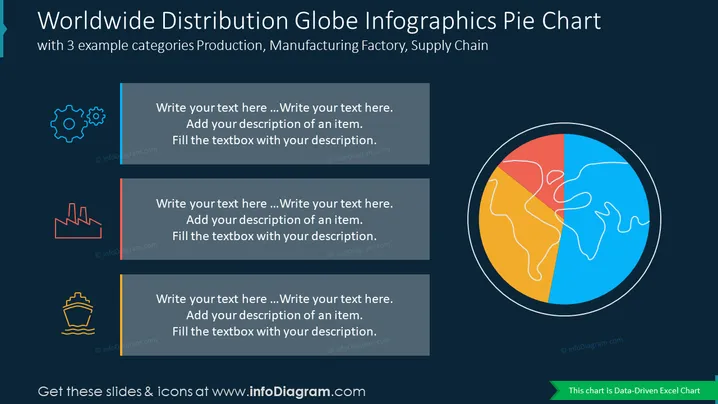
This PowerPoint slide template effectively visualizes the global distribution of product sales using a satellite chart. The chart segments the world into six geographical regions, each represented by a pie chart slice. The size of each slice corresponds to the percentage of total sales in that region. Additional text boxes provide insights into specific regional sales strategies. This slide is ideal for presentations that discuss global sales performance, market segmentation, and regional sales strategies. It can also be used to highlight the company's global reach and its ability to adapt to different markets.


