infoDiagram
>
Content-ready Topics
>
Management
>
Company Presentation Template and Slide Deck (PPTX)
>
Key services revenue
Key services revenue
from deck
Company Presentation Template and Slide Deck (PPTX)
- Info
- How To Edit
- Usage example
Info
KEY SERVICES REVENUE
Slide Content
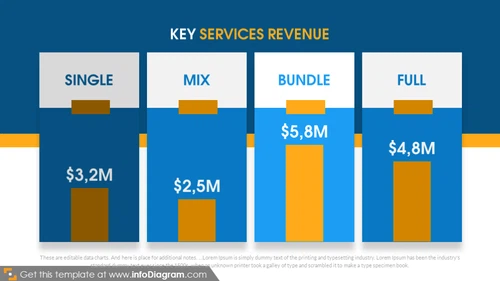
The PowerPoint slide titled "KEY SERVICES REVENUE" appears to represent revenue data for a business, broken down into four categories: Single, Mix, Bundle, and Full. Each category has a corresponding revenue value associated with it: Single shows $3.2M, Mix indicates $2.5M, Bundle is at $5.8M, and Full displays $4.8M. These values suggest the revenue generated from different service offerings or product combinations, potentially indicating a strategy where bundled offerings generate the most revenue.
Graphical Look
- The slide background is a dark blue color.
- The slide title "KEY SERVICES REVENUE" is written in bold, white capital letters placed at the top center.
- There are four vertical bar charts, each representing a different category (Single, Mix, Bundle, Full).
- Each bar is a lighter blue than the background, making a clear contrast against it.
- The monetary values are written at the top of each bar in white font, indicating the revenue for that category.
- Each category title is placed within a white rectangle above the corresponding bar.
- There are rectangular color blocks (in a darker orange) on each bar chart, with no text, possibly placeholders for additional data or icons.
The visual composition of the slide is clean and professional, with a strong contrast between the background and bar charts. The use of blue and orange maintains a corporate aesthetic, while the white text stands out for easy readability.
Use Cases
- Presenting quarterly or annual financial results to stakeholders or investors.
- Comparing revenue performance across different service lines in a business meeting.
- Evaluating the effectiveness of different sales strategies during a marketing presentation.
- Showcasing product or service performance metrics to a team or department within a company.
How To Edit
How to edit text & colors

How to expand / shorten diagram

How to Replace Icons in infoDiagram PPT


