Your graphics add a nice touch to my presentations and I recently used them for one of my all-hands meetings. Your toolbox adds professionalism to my slides. Instead of using standard clipart.
Claude Jones, Director of Engineer, @Walmartlabs, USA
Your graphics add a nice touch to my presentations and I recently used them for one of my all-hands meetings. Your toolbox adds professionalism to my slides. Instead of using standard clipart.
Claude Jones, Director of Engineer, @Walmartlabs, USA
I needed a fresh look at some of my slides. I've tried to find a way to create a paintbrush effect, to underline, accentuate, add some color and the handwritten markers were just the things. Very easy to use, easy to size, change the color. It was an affordable, perfect solution and I'm happy to recommend it.
Anonymous, US
The crisp, clean look of the graphics, and the fact that it allowed me to easily edit and change the colors to match the template was my main reason for purchasing them.
Brandie Jenkins, E-learning Developer, USA
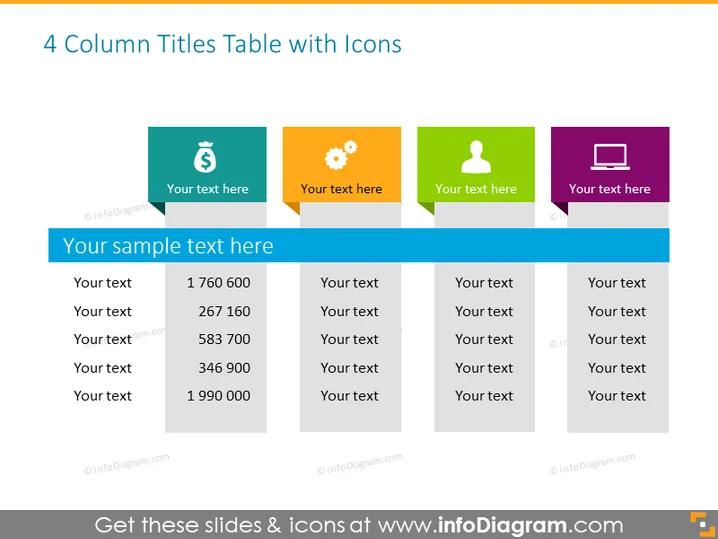
The slide is titled '4 Column Titles Table with Icons.' It consists of a table with four columns, each with a distinct color (teal, orange, green, and purple) and an icon at the top: a dollar sign, a gear, a person's silhouette, and a laptop, respectively. These icons could symbolize finance, operations, human resources, and technology. Beneath each icon, placeholder text invites the addition of subject-specific content. The column beneath the finance icon (dollar sign) contains numerical data, suggesting financial figures.
The slide has a clean, professional look with a simple yet effective use of color to differentiate between topics. The use of icons adds a visual shorthand for the content types being presented.


