Financial Decks
Visualize your results with ease
4 elements template pipeline showing the result with description notes
from deck
Pipe Flow Chart Diagrams (PPT Template)
Info
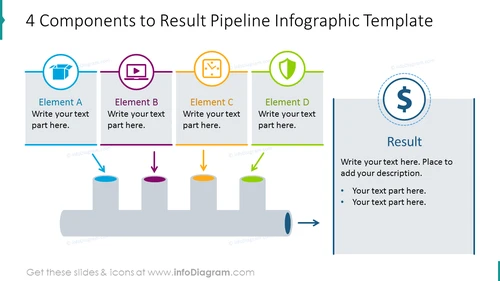
4 Components to Result Pipeline Infographic Template
Slide Content
The slide portrays a step-by-step process with four key elements, leading to a final result. Element A, B, C, and D are represented as distinct stages, each with placeholder text for additional information and an accompanying symbolic icon. The progression from these elements to the final result is signified through arrows indicating movement and cylindrical icons representing incremental achievements or objectives. Finally, a large, isolated area is dedicated to the "Result," featuring a dollar sign icon, suggesting that the outcome has a financial or valuable implication.
Graphical Look
- A large, bold title at the top in dark text.
- Four rectangular, colorful text boxes labeled Element A, B, C, and D from left to right, each framed in a different color with matching arrows pointing downwards.
- Each box contains a unique icon inside a circle: a folder, play button, checklist, and shield respectively.
- A horizontal pipeline graphic with three cylindrical shapes representing a flow or process, each aligned under a respective arrow.
- Large, end-result rectangle on the right with a dashed circle enclosing a dollar sign symbol, connoting financial results.
- Text placeholders underneath each element and result section for custom descriptions.
- Two bulleted text placeholders under the result section for additional details.
- A thick blue arrow at the bottom pointing right, emphasizing the progression towards the result.
The slide has a clean and professional design, using a blend of colors to distinguish the elements. Icons are simple yet suggestive of the type of content they represent.
Use Cases
- Illustrating step-by-step processes in sales, marketing strategies, or project management.
- Presenting a sequence of events leading to a monetary or business outcome in financial reports or investment pitches.
- Visualizing workflow procedures or systems in organizational training materials.
- Exhibiting progress from initial concepts to final results in product development presentations.


