Your graphics add a nice touch to my presentations and I recently used them for one of my all-hands meetings. Your toolbox adds professionalism to my slides. Instead of using standard clipart.
Claude Jones, Director of Engineer, @Walmartlabs, USA
Your graphics add a nice touch to my presentations and I recently used them for one of my all-hands meetings. Your toolbox adds professionalism to my slides. Instead of using standard clipart.
Claude Jones, Director of Engineer, @Walmartlabs, USA
I needed a fresh look at some of my slides. I've tried to find a way to create a paintbrush effect, to underline, accentuate, add some color and the handwritten markers were just the things. Very easy to use, easy to size, change the color. It was an affordable, perfect solution and I'm happy to recommend it.
Anonymous, US
The crisp, clean look of the graphics, and the fact that it allowed me to easily edit and change the colors to match the template was my main reason for purchasing them.
Brandie Jenkins, E-learning Developer, USA
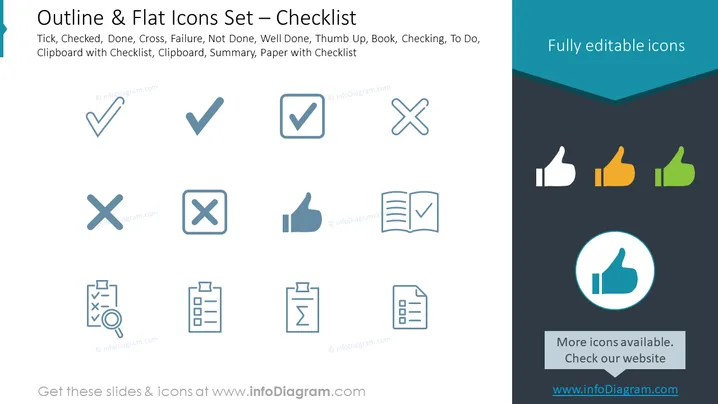
The PowerPoint slide is centered around a collection of outline and flat-design icons focused on "Checklist" themes. The icons depict various stages and statuses related to tasks such as completion, approval, and in-progress actions. The titles under each icon provide context, listing "Tick, Checked, Done" as positive completion indicators, "Cross, Failure, Not Done" as negative status indicators, "Well Done, Thumb Up" as commendations, and "Book, Checking, To Do, Clipboard with Checklist, Clipboard, Summary, Paper with Checklist" as tools or actions associated with managing tasks or summarizing work.
The slide has a clean, modern look with plenty of white space around the icons to ensure they are easy to distinguish. The consistent icon design and limited color palette provide a professional and cohesive appearance.


