Your graphics add a nice touch to my presentations and I recently used them for one of my all-hands meetings. Your toolbox adds professionalism to my slides. Instead of using standard clipart.
Claude Jones, Director of Engineer, @Walmartlabs, USA
Your graphics add a nice touch to my presentations and I recently used them for one of my all-hands meetings. Your toolbox adds professionalism to my slides. Instead of using standard clipart.
Claude Jones, Director of Engineer, @Walmartlabs, USA
I needed a fresh look at some of my slides. I've tried to find a way to create a paintbrush effect, to underline, accentuate, add some color and the handwritten markers were just the things. Very easy to use, easy to size, change the color. It was an affordable, perfect solution and I'm happy to recommend it.
Anonymous, US
The crisp, clean look of the graphics, and the fact that it allowed me to easily edit and change the colors to match the template was my main reason for purchasing them.
Brandie Jenkins, E-learning Developer, USA
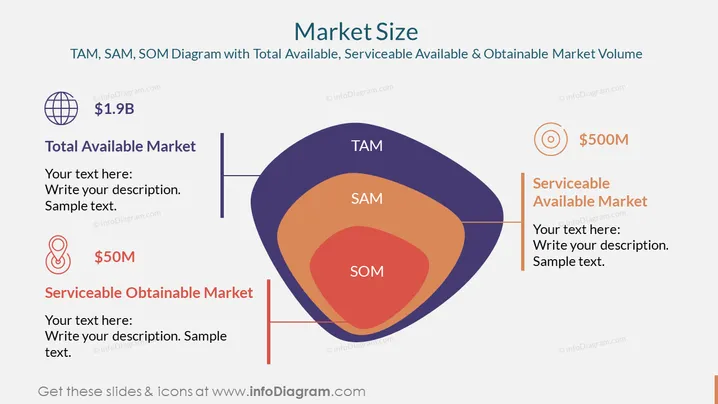
The PowerPoint slide presents a TAM, SAM, SOM diagram depicting the Total Available Market, Serviceable Available Market, and Serviceable Obtainable Market. TAM represents the total market demand for a product or service, SAM is the segment of the TAM targeted by a company's products or services which is within its geographical reach, and SOM is the portion of SAM that a company can capture or serve. Each market layer is visually distinct and accompanied by a monetary value—$1.9B for TAM, $500M for SAM, and $50M for SOM—providing an abstract representation of market sizing and potential revenue.
The overall look is clean and modern, with a focus on conveying the market potential through the use of bold colors and distinct shapes. The use of icons helps to visually differentiate between the types of markets.


