Your graphics add a nice touch to my presentations and I recently used them for one of my all-hands meetings. Your toolbox adds professionalism to my slides. Instead of using standard clipart.
Claude Jones, Director of Engineer, @Walmartlabs, USA
Your graphics add a nice touch to my presentations and I recently used them for one of my all-hands meetings. Your toolbox adds professionalism to my slides. Instead of using standard clipart.
Claude Jones, Director of Engineer, @Walmartlabs, USA
I needed a fresh look at some of my slides. I've tried to find a way to create a paintbrush effect, to underline, accentuate, add some color and the handwritten markers were just the things. Very easy to use, easy to size, change the color. It was an affordable, perfect solution and I'm happy to recommend it.
Anonymous, US
The crisp, clean look of the graphics, and the fact that it allowed me to easily edit and change the colors to match the template was my main reason for purchasing them.
Brandie Jenkins, E-learning Developer, USA
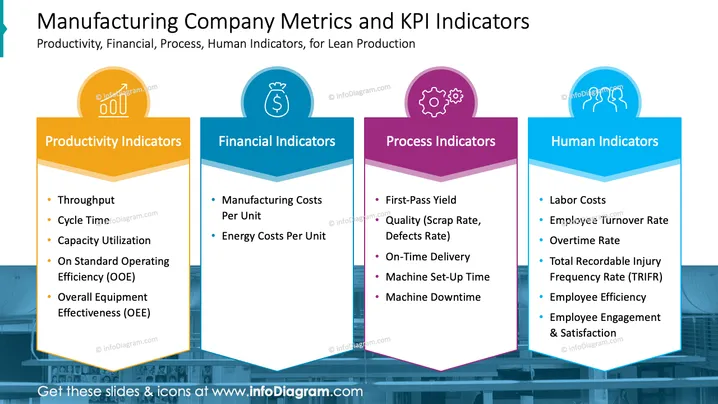
The slide is titled "Manufacturing Company Metrics and KPI Indicators" and is about various types of indicators for monitoring a manufacturing company's performance. It is divided into four categories: Productivity Indicators, which include throughput, cycle time, capacity utilization, on standard operating efficiency (OEE), and overall equipment effectiveness (OEE); Financial Indicators, covering manufacturing and energy costs per unit; Process Indicators, such as first-pass yield, quality (scrap rate, defects rate), on-time delivery, machine set-up time, and machine downtime; and Human Indicators, listing labor costs, employee turnover rate, overtime rate, total recordable injury frequency rate (TRIFR), employee efficiency, and employee engagement & satisfaction.
The overall look of the slide is modern and organized, with a color-coordinated scheme that clearly differentiates the four categories of metrics and indicators. The icons and contrasting ribbon banners create an easy-to-navigate visual structure for presenting complex information.


