Your graphics add a nice touch to my presentations and I recently used them for one of my all-hands meetings. Your toolbox adds professionalism to my slides. Instead of using standard clipart.
Claude Jones, Director of Engineer, @Walmartlabs, USA
Your graphics add a nice touch to my presentations and I recently used them for one of my all-hands meetings. Your toolbox adds professionalism to my slides. Instead of using standard clipart.
Claude Jones, Director of Engineer, @Walmartlabs, USA
I needed a fresh look at some of my slides. I've tried to find a way to create a paintbrush effect, to underline, accentuate, add some color and the handwritten markers were just the things. Very easy to use, easy to size, change the color. It was an affordable, perfect solution and I'm happy to recommend it.
Anonymous, US
The crisp, clean look of the graphics, and the fact that it allowed me to easily edit and change the colors to match the template was my main reason for purchasing them.
Brandie Jenkins, E-learning Developer, USA
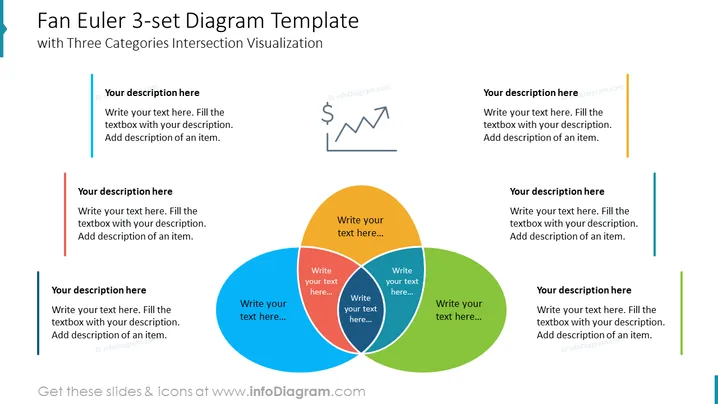
The slide presents a Fan Euler 3-set Diagram Template, which is used for depicting the relationships and intersections between three categories. Each set is represented by a differently colored, semi-transparent circle, intersecting with others to create areas for describing overlaps. The template contains placeholders ("Write your text here...") for detailed descriptions within each set and their intersections. Additionally, there are text boxes positioned around the diagram for further explanations of individual categories, making it a versatile tool for visualizing complex relationships in a variety of contexts.
The slide’s overall look is clean and professional, with a clear focus on the Fan Euler diagram. The use of color-coordinated elements with simple icons makes it visually engaging and easy to understand.


