Your graphics add a nice touch to my presentations and I recently used them for one of my all-hands meetings. Your toolbox adds professionalism to my slides. Instead of using standard clipart.
Claude Jones, Director of Engineer, @Walmartlabs, USA
Your graphics add a nice touch to my presentations and I recently used them for one of my all-hands meetings. Your toolbox adds professionalism to my slides. Instead of using standard clipart.
Claude Jones, Director of Engineer, @Walmartlabs, USA
I needed a fresh look at some of my slides. I've tried to find a way to create a paintbrush effect, to underline, accentuate, add some color and the handwritten markers were just the things. Very easy to use, easy to size, change the color. It was an affordable, perfect solution and I'm happy to recommend it.
Anonymous, US
The crisp, clean look of the graphics, and the fact that it allowed me to easily edit and change the colors to match the template was my main reason for purchasing them.
Brandie Jenkins, E-learning Developer, USA
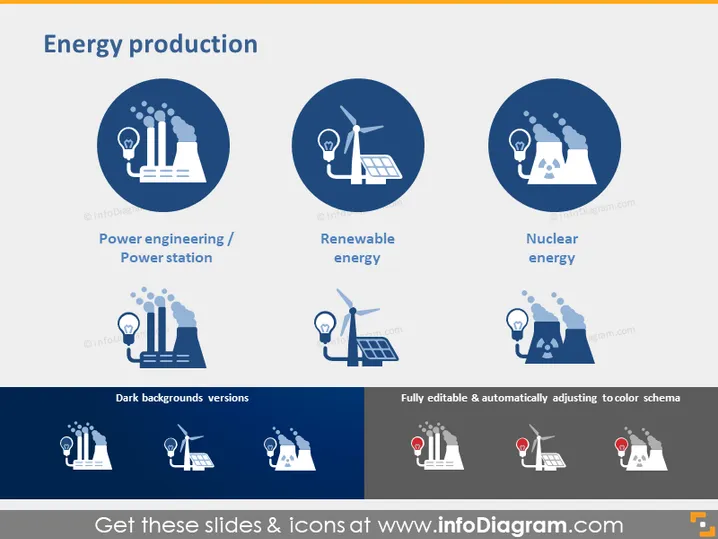
The PowerPoint slide is titled "Energy production" and features three main categories: Power engineering/Power station, Renewable energy, and Nuclear energy. Power engineering represents traditional methods of electricity generation through fossil fuels, depicted by factory-like structures emitting smoke next to a light bulb. Renewable energy refers to eco-friendly sources, symbolized by wind turbines alongside a light bulb. Nuclear energy suggests electricity production from nuclear sources, indicated by a cooling tower with atomic symbols and a light bulb.
The slide has a clean and modern design with a consistent color palette of dark and light blues, whites, and greys. The icons are stylized and feature straightforward imagery related to each energy production method.


