Your graphics add a nice touch to my presentations and I recently used them for one of my all-hands meetings. Your toolbox adds professionalism to my slides. Instead of using standard clipart.
Claude Jones, Director of Engineer, @Walmartlabs, USA
Your graphics add a nice touch to my presentations and I recently used them for one of my all-hands meetings. Your toolbox adds professionalism to my slides. Instead of using standard clipart.
Claude Jones, Director of Engineer, @Walmartlabs, USA
I needed a fresh look at some of my slides. I've tried to find a way to create a paintbrush effect, to underline, accentuate, add some color and the handwritten markers were just the things. Very easy to use, easy to size, change the color. It was an affordable, perfect solution and I'm happy to recommend it.
Anonymous, US
The crisp, clean look of the graphics, and the fact that it allowed me to easily edit and change the colors to match the template was my main reason for purchasing them.
Brandie Jenkins, E-learning Developer, USA
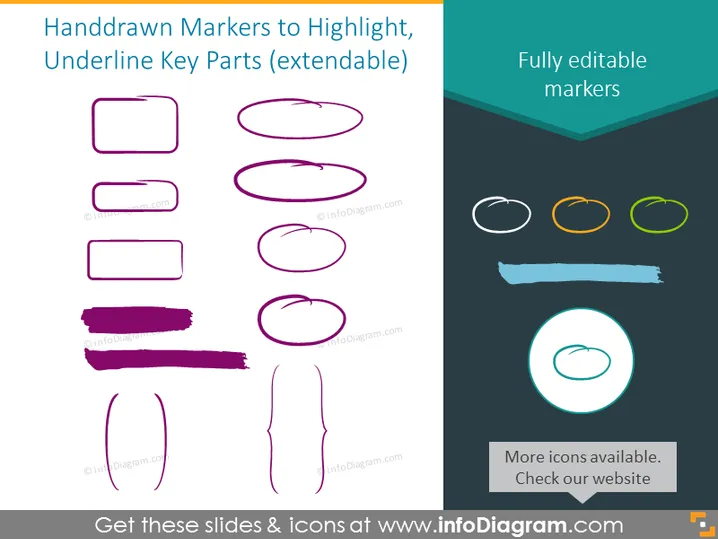
The PowerPoint slide presents an array of handdrawn markers designed for highlighting or underlining essential parts of a presentation. These markers are noted as extendable, allowing for customization. The 'fully editable markers' indicate that users can modify these elements to suit their presentation needs. Each type of marker or underline serves to emphasize text or elements in unique ways, aiding in drawing attention or structuring content more clearly.
The slide has a creative and informal feel, leveraging sketched elements that give the slide a handcrafted touch. The color contrasts and spatial arrangement guide the eye and create distinct areas of focus.


