Your graphics add a nice touch to my presentations and I recently used them for one of my all-hands meetings. Your toolbox adds professionalism to my slides. Instead of using standard clipart.
Claude Jones, Director of Engineer, @Walmartlabs, USA
Your graphics add a nice touch to my presentations and I recently used them for one of my all-hands meetings. Your toolbox adds professionalism to my slides. Instead of using standard clipart.
Claude Jones, Director of Engineer, @Walmartlabs, USA
I needed a fresh look at some of my slides. I've tried to find a way to create a paintbrush effect, to underline, accentuate, add some color and the handwritten markers were just the things. Very easy to use, easy to size, change the color. It was an affordable, perfect solution and I'm happy to recommend it.
Anonymous, US
The crisp, clean look of the graphics, and the fact that it allowed me to easily edit and change the colors to match the template was my main reason for purchasing them.
Brandie Jenkins, E-learning Developer, USA
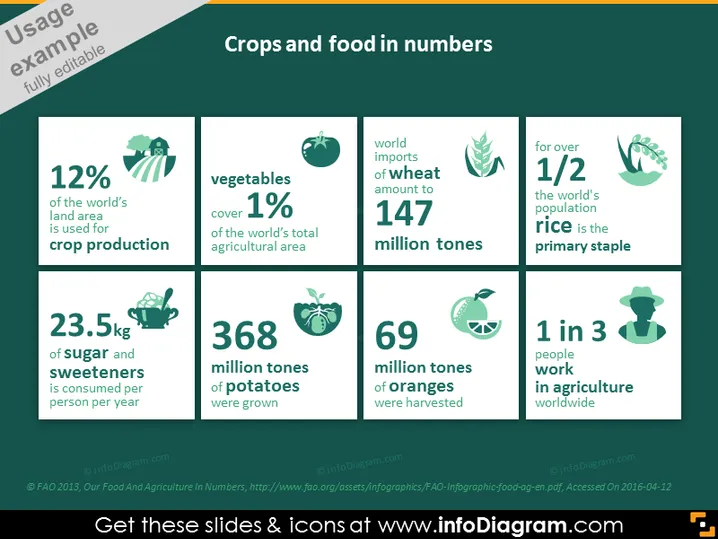
The slide presents statistical data related to agriculture and food production globally. It highlights that 12% of the world's land area is used for crop production, indicating the scale of land designated for agriculture. Vegetables occupy 1% of the world's total agricultural land, showing a specific subset within agriculture. It is noted that 23.5 kg of sugar and sweeteners are consumed per person per year, raising awareness about dietary consumption patterns. The statistic of 368 million tons of potatoes grown emphasizes the scale of this specific crop's production. With 69 million tons of oranges harvested, it reflects the global citrus industry. The importation of 147 million tons of wheat sheds light on the grain trade. Pointing out that over half the world's population relies on rice as the primary staple food illustrates rice's significance. Lastly, the fact that 1 in 3 people work in agriculture worldwide underscores the sector's importance for employment.
The overall look of the slide is professional and visually engaging. The color-coded blocks and corresponding icons help in quickly conveying the key messages about global agriculture and food production.
The slide titled "Crops and food in numbers" displays key statistics on global agriculture. Each stat is depicted with a simple icon relating to the data presented. The facts include that 12% of the world's land is for crop production, vegetables cover 1% of the total agricultural area, and the significant consumption of sugar and sweeteners at 23.5 kg per person annually. Additionally, 368 million tons of potatoes and 69 million tons of oranges indicate crop-specific outputs. With 147 million tons of wheat being imported globally, the slide also highlights international trade aspects, while stating that over half of the world's population regards rice as their primary staple, and 1 in 3 people work in agriculture, spotlighting the industry's widespread impact.
The slide is designed with a clean and organized aesthetic, using contrasting colors and icons for visual clarity and emphasis on the key information provided.


