Your graphics add a nice touch to my presentations and I recently used them for one of my all-hands meetings. Your toolbox adds professionalism to my slides. Instead of using standard clipart.
Claude Jones, Director of Engineer, @Walmartlabs, USA
Your graphics add a nice touch to my presentations and I recently used them for one of my all-hands meetings. Your toolbox adds professionalism to my slides. Instead of using standard clipart.
Claude Jones, Director of Engineer, @Walmartlabs, USA
I needed a fresh look at some of my slides. I've tried to find a way to create a paintbrush effect, to underline, accentuate, add some color and the handwritten markers were just the things. Very easy to use, easy to size, change the color. It was an affordable, perfect solution and I'm happy to recommend it.
Anonymous, US
The crisp, clean look of the graphics, and the fact that it allowed me to easily edit and change the colors to match the template was my main reason for purchasing them.
Brandie Jenkins, E-learning Developer, USA
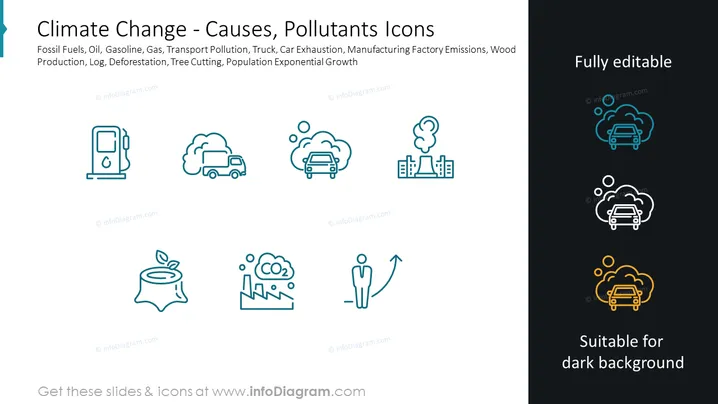
The slide presents a series of icons representing various causes and pollutants contributing to climate change. These icons signify different sources of emissions such as fossil fuels, transportation, and deforestation. The sources are listed: Fossil Fuels, Oil, Gasoline, Gas, Transport Pollution, Truck, Car Exhaustion, Manufacturing Factory Emissions, Wood Production, Log, Deforestation, Tree Cutting, and Population Exponential Growth. These terms elaborate on human-induced factors that exacerbate greenhouse gas concentrations and subsequently impact global climate patterns.
The overall visual design is clean and modern, using contrasting colors to highlight that the icons are adaptable for different background colors. The icons are simplistic in a way that allows for immediate recognition of the various causes and pollutants related to climate change.


