
Your graphics add a nice touch to my presentations and I recently used them for one of my all-hands meetings. Your toolbox adds professionalism to my slides. Instead of using standard clipart.
Claude Jones, Director of Engineer, @Walmartlabs, USA

Your graphics add a nice touch to my presentations and I recently used them for one of my all-hands meetings. Your toolbox adds professionalism to my slides. Instead of using standard clipart.
Claude Jones, Director of Engineer, @Walmartlabs, USA

I needed a fresh look at some of my slides. I've tried to find a way to create a paintbrush effect, to underline, accentuate, add some color and the handwritten markers were just the things. Very easy to use, easy to size, change the color. It was an affordable, perfect solution and I'm happy to recommend it.
Anonymous, US
The crisp, clean look of the graphics, and the fact that it allowed me to easily edit and change the colors to match the template was my main reason for purchasing them.
Brandie Jenkins, E-learning Developer, USA
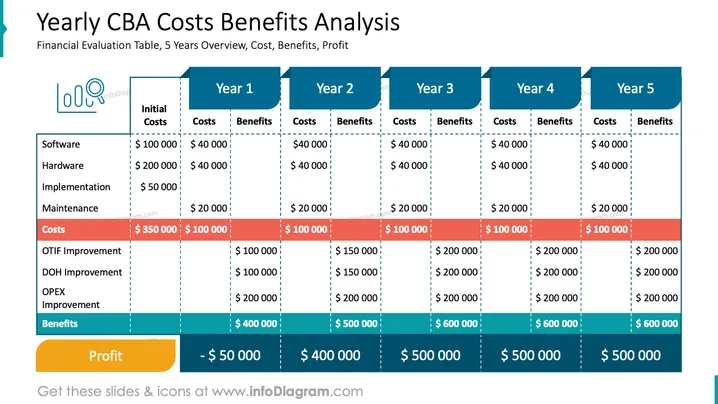
The slide presents a five-year financial evaluation table showcasing the costs, benefits, and profit of a potential investment. Each year's costs and benefits are listed with projected amounts for software, hardware, and other related investments and returns. "OTIF Improvement" and "DOH Improvement" hint at specific operational improvements, probably related to logistical or supply chain efficiencies, whereas "OPEX Improvement" indicates ongoing operational expenditure optimizations. The final row displays an overall profit, starting with a loss in the first year and gradually increasing profits in the subsequent years.
The overall look of the slide is clean and professional with a color-coded scheme to distinguish between costs, benefits, and profit, making the data easy to interpret at a glance.


