

Your graphics add a nice touch to my presentations and I recently used them for one of my all-hands meetings. Your toolbox adds professionalism to my slides. Instead of using standard clipart.
Claude Jones, Director of Engineer, @Walmartlabs, USA

Your graphics add a nice touch to my presentations and I recently used them for one of my all-hands meetings. Your toolbox adds professionalism to my slides. Instead of using standard clipart.
Claude Jones, Director of Engineer, @Walmartlabs, USA
I needed a fresh look at some of my slides. I've tried to find a way to create a paintbrush effect, to underline, accentuate, add some color and the handwritten markers were just the things. Very easy to use, easy to size, change the color. It was an affordable, perfect solution and I'm happy to recommend it.
Anonymous, US
The crisp, clean look of the graphics, and the fact that it allowed me to easily edit and change the colors to match the template was my main reason for purchasing them.
Brandie Jenkins, E-learning Developer, USA
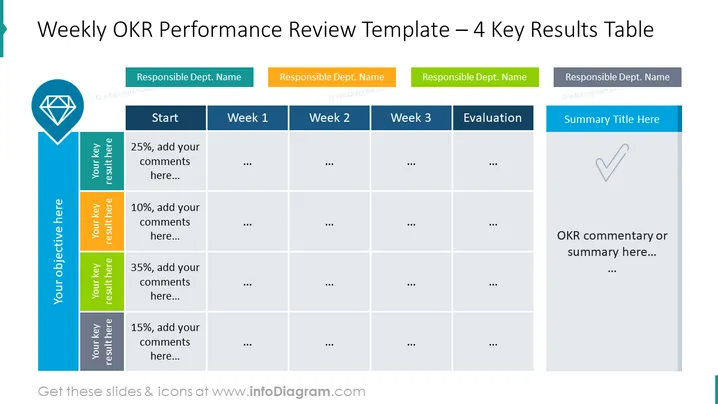
The slide presents a structured approach to tracking Objectives and Key Results (OKRs) on a weekly basis. Each of the four key results has a dedicated row with placeholders for the user to input percentages and comments. The slide tracks progress over three weeks, followed by an evaluation column and ends with a summary column designed for an OKR commentary or overall summary.
The slide utilizes a color-coded tabular format to delineate sections and ensure visual clarity. Icons and color contrast are employed to guide viewers through the structure and progression of the OKR tracking from the start to summary.



