
Your graphics add a nice touch to my presentations and I recently used them for one of my all-hands meetings. Your toolbox adds professionalism to my slides. Instead of using standard clipart.
Claude Jones, Director of Engineer, @Walmartlabs, USA

Your graphics add a nice touch to my presentations and I recently used them for one of my all-hands meetings. Your toolbox adds professionalism to my slides. Instead of using standard clipart.
Claude Jones, Director of Engineer, @Walmartlabs, USA

I needed a fresh look at some of my slides. I've tried to find a way to create a paintbrush effect, to underline, accentuate, add some color and the handwritten markers were just the things. Very easy to use, easy to size, change the color. It was an affordable, perfect solution and I'm happy to recommend it.
Anonymous, US
The crisp, clean look of the graphics, and the fact that it allowed me to easily edit and change the colors to match the template was my main reason for purchasing them.
Brandie Jenkins, E-learning Developer, USA
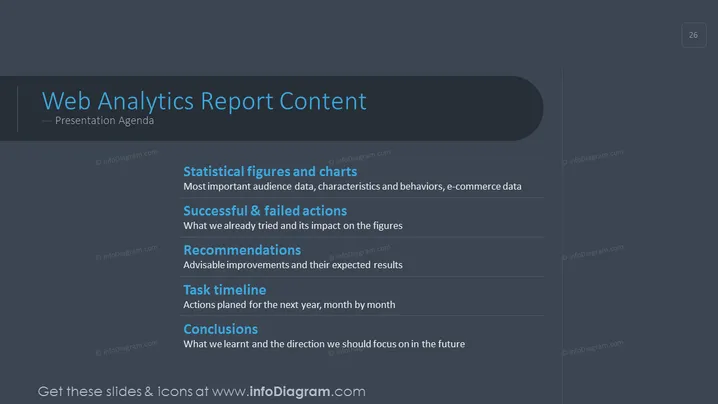
The slide outlines a structured agenda for presenting a Web Analytics Report. It starts with "Statistical figures and charts," which details important audience data, characteristics, behaviors, and e-commerce data, presumably with quantitative insights. Next, it discusses "Successful & failed actions," reflecting on past strategies and their effects. Following this, "Recommendations" are offered, suggesting improvements and expected outcomes. A "Task timeline" then lays out a month-by-month plan for the coming year. Lastly, "Conclusions" summarize key learnings and future strategic focus areas.
The overall look of the slide is professional and modern, with a simple color palette that emphasizes legibility and clarity.


