
Your graphics add a nice touch to my presentations and I recently used them for one of my all-hands meetings. Your toolbox adds professionalism to my slides. Instead of using standard clipart.
Claude Jones, Director of Engineer, @Walmartlabs, USA

Your graphics add a nice touch to my presentations and I recently used them for one of my all-hands meetings. Your toolbox adds professionalism to my slides. Instead of using standard clipart.
Claude Jones, Director of Engineer, @Walmartlabs, USA

I needed a fresh look at some of my slides. I've tried to find a way to create a paintbrush effect, to underline, accentuate, add some color and the handwritten markers were just the things. Very easy to use, easy to size, change the color. It was an affordable, perfect solution and I'm happy to recommend it.
Anonymous, US
The crisp, clean look of the graphics, and the fact that it allowed me to easily edit and change the colors to match the template was my main reason for purchasing them.
Brandie Jenkins, E-learning Developer, USA
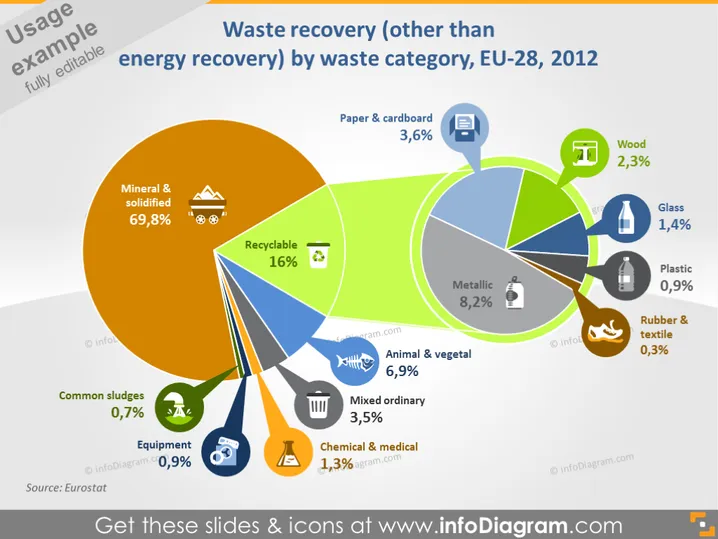
This slide presents statistics on waste recovery in the EU-28 for the year 2012, excluding energy recovery. It focuses on the breakdown by waste category, with a pie chart that points to individual sub-charts for each category. Mineral and solidified waste dominates at 69.8%, followed by recyclables at 16%, and metallic wastes at 8.2%. Other categories include paper & cardboard, wood, glass, plastic, rubber & textile, animal & vegetal, common sludges, equipment, chemical & medical, and mixed ordinary wastes with percentages ranging from 0.3% to 6.9%.
The slide has a vibrant and informative design with a clear visual hierarchy that emphasizes the statistics provided. The use of colors, icons, and percentages aids in quick comprehension of the data.


