

Your graphics add a nice touch to my presentations and I recently used them for one of my all-hands meetings. Your toolbox adds professionalism to my slides. Instead of using standard clipart.
Claude Jones, Director of Engineer, @Walmartlabs, USA

Your graphics add a nice touch to my presentations and I recently used them for one of my all-hands meetings. Your toolbox adds professionalism to my slides. Instead of using standard clipart.
Claude Jones, Director of Engineer, @Walmartlabs, USA
I needed a fresh look at some of my slides. I've tried to find a way to create a paintbrush effect, to underline, accentuate, add some color and the handwritten markers were just the things. Very easy to use, easy to size, change the color. It was an affordable, perfect solution and I'm happy to recommend it.
Anonymous, US
The crisp, clean look of the graphics, and the fact that it allowed me to easily edit and change the colors to match the template was my main reason for purchasing them.
Brandie Jenkins, E-learning Developer, USA
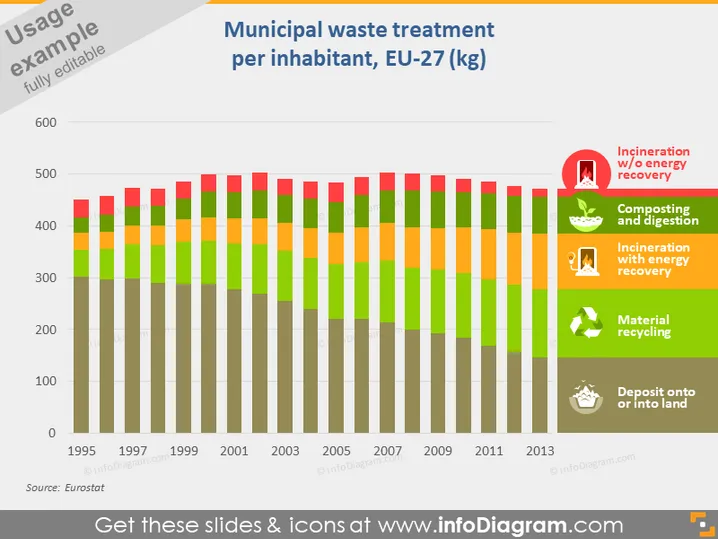
The PowerPoint slide presents data on "Municipal waste treatment per inhabitant in EU-27 (kg)" showcasing a time-series analysis from 1995 to 2013. The stacked bar chart represents different waste treatment methods by color. Incineration without energy recovery (red), composting and digestion (orange), incineration with energy recovery (light green), material recycling (green), and deposit onto or into land (brown) indicate varying treatment strategies and their use over time. This visual data aids in understanding the evolution of waste management practices within the European Union.
The overall look of the slide is clean and professional, with a clear emphasis on data representation through color coding and a well-structured bar chart. The graphical elements are used effectively to facilitate comprehension of complex data.



