

Your graphics add a nice touch to my presentations and I recently used them for one of my all-hands meetings. Your toolbox adds professionalism to my slides. Instead of using standard clipart.
Claude Jones, Director of Engineer, @Walmartlabs, USA

Your graphics add a nice touch to my presentations and I recently used them for one of my all-hands meetings. Your toolbox adds professionalism to my slides. Instead of using standard clipart.
Claude Jones, Director of Engineer, @Walmartlabs, USA
I needed a fresh look at some of my slides. I've tried to find a way to create a paintbrush effect, to underline, accentuate, add some color and the handwritten markers were just the things. Very easy to use, easy to size, change the color. It was an affordable, perfect solution and I'm happy to recommend it.
Anonymous, US
The crisp, clean look of the graphics, and the fact that it allowed me to easily edit and change the colors to match the template was my main reason for purchasing them.
Brandie Jenkins, E-learning Developer, USA
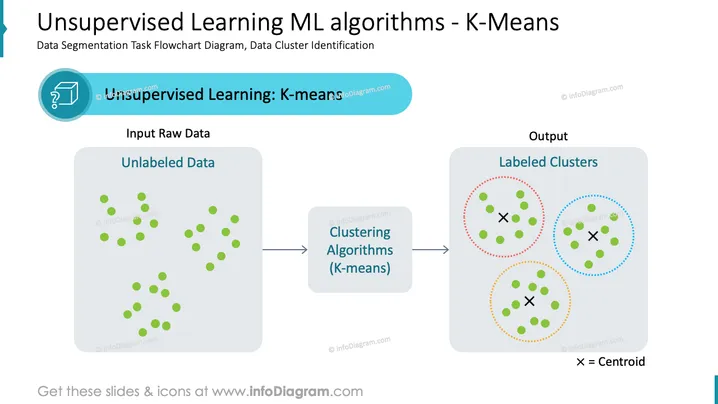
The slide presents a flowchart diagram demonstrating the process of data segmentation using Unsupervised Learning with a focus on the K-Means clustering algorithm. It begins with 'Input Raw Data' showcasing 'Unlabeled Data', indicating initial data that has not yet been categorized. The next step displays 'Clustering Algorithms (K-means)', which represents the method used for grouping data into clusters based on similarity. The final output shows 'Labeled Clusters' with centroids marked, illustrating the outcome of data having been organized into distinct groups by the K-Means algorithm.
The slide has a clean and professional look with a clear flow of information from left to right. The use of colors and shapes makes it easy to differentiate between the various stages of the machine learning process.



