

Your graphics add a nice touch to my presentations and I recently used them for one of my all-hands meetings. Your toolbox adds professionalism to my slides. Instead of using standard clipart.
Claude Jones, Director of Engineer, @Walmartlabs, USA

Your graphics add a nice touch to my presentations and I recently used them for one of my all-hands meetings. Your toolbox adds professionalism to my slides. Instead of using standard clipart.
Claude Jones, Director of Engineer, @Walmartlabs, USA
I needed a fresh look at some of my slides. I've tried to find a way to create a paintbrush effect, to underline, accentuate, add some color and the handwritten markers were just the things. Very easy to use, easy to size, change the color. It was an affordable, perfect solution and I'm happy to recommend it.
Anonymous, US
The crisp, clean look of the graphics, and the fact that it allowed me to easily edit and change the colors to match the template was my main reason for purchasing them.
Brandie Jenkins, E-learning Developer, USA
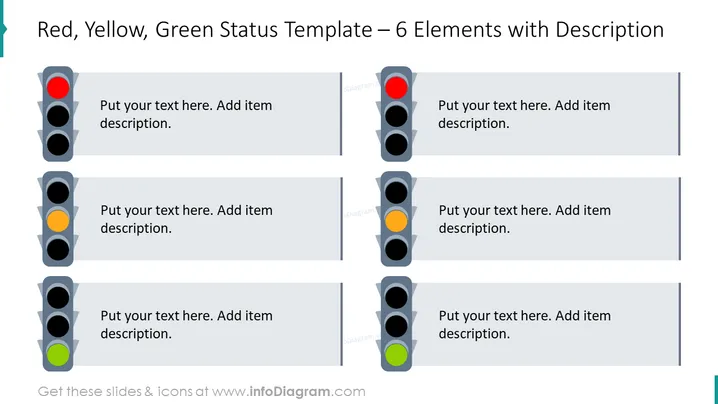
The slide is structured to present a status report across six categories, using the traffic light color-coding system to denote different levels of urgency or completion. Red signifies critical issues or stops, yellow indicates caution or tasks that are in progress and require attention, and green represents tasks that are complete or on target. This visual approach offers a clear and immediate understanding of project status or operational health.
The slide has a simple, organized layout with a repetitive structure that makes it easy to compare statuses across different elements. The color coding is instantly recognizable and conveys the intended message efficiently.
This slide would be useful in a variety of business presentations, particularly for project management updates, operational status meetings, or any scenario where a clear visual representation of progress is required. It's also suitable for dashboards in performance reporting.



