

Your graphics add a nice touch to my presentations and I recently used them for one of my all-hands meetings. Your toolbox adds professionalism to my slides. Instead of using standard clipart.
Claude Jones, Director of Engineer, @Walmartlabs, USA

Your graphics add a nice touch to my presentations and I recently used them for one of my all-hands meetings. Your toolbox adds professionalism to my slides. Instead of using standard clipart.
Claude Jones, Director of Engineer, @Walmartlabs, USA
I needed a fresh look at some of my slides. I've tried to find a way to create a paintbrush effect, to underline, accentuate, add some color and the handwritten markers were just the things. Very easy to use, easy to size, change the color. It was an affordable, perfect solution and I'm happy to recommend it.
Anonymous, US
The crisp, clean look of the graphics, and the fact that it allowed me to easily edit and change the colors to match the template was my main reason for purchasing them.
Brandie Jenkins, E-learning Developer, USA
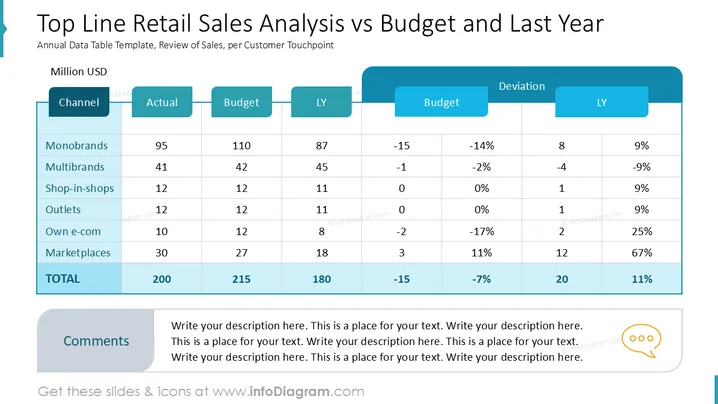
This slide presents a retail sales analysis report comparing actual sales, budgets, and last year's figures across various channels.
The slide features a neatly organized table with alternating shaded rows for clarity.
Headers for "Channel," "Actual," "Budget," "LY," and "Deviation" are in bold fonts on colored backgrounds.
The table uses teal and light blue for highlighting totals and embedding emphasis.
Rounded corner boxes and consistent typeface for a modern, clean appearance.
Comments section below, encapsulated in a rounded edge box with a speech bubble icon.
The slide exhibits a balanced combination of text and color, providing a professional and structured financial overview.



