

Your graphics add a nice touch to my presentations and I recently used them for one of my all-hands meetings. Your toolbox adds professionalism to my slides. Instead of using standard clipart.
Claude Jones, Director of Engineer, @Walmartlabs, USA

Your graphics add a nice touch to my presentations and I recently used them for one of my all-hands meetings. Your toolbox adds professionalism to my slides. Instead of using standard clipart.
Claude Jones, Director of Engineer, @Walmartlabs, USA
I needed a fresh look at some of my slides. I've tried to find a way to create a paintbrush effect, to underline, accentuate, add some color and the handwritten markers were just the things. Very easy to use, easy to size, change the color. It was an affordable, perfect solution and I'm happy to recommend it.
Anonymous, US
The crisp, clean look of the graphics, and the fact that it allowed me to easily edit and change the colors to match the template was my main reason for purchasing them.
Brandie Jenkins, E-learning Developer, USA
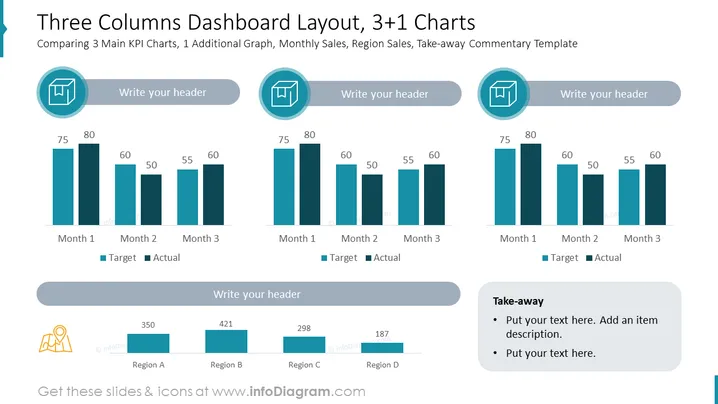
The PowerPoint slide titled "Three Columns Dashboard Layout, 3+1 Charts" is aimed at comparing 3 main KPI charts relating to monthly sales, alongside an additional graph demonstrating region sales. There is also a section for take-away commentary. Each column features a bar graph with two sets of figures per month labeled "Target" and "Actual," showing a comparison of performance against goals. The additional graph correlates to four different regions, with numerical values indicating amounts or metrics specific to those regions. The take-away section provides bullet points for summarizing key notes or action items.
The slide has a clean and professional appearance with a color scheme focused on various shades of blue and gray. The visual consistency between the charts, icons, and text boxes gives the slide a cohesive look.



