
Your graphics add a nice touch to my presentations and I recently used them for one of my all-hands meetings. Your toolbox adds professionalism to my slides. Instead of using standard clipart.
Claude Jones, Director of Engineer, @Walmartlabs, USA
Your graphics add a nice touch to my presentations and I recently used them for one of my all-hands meetings. Your toolbox adds professionalism to my slides. Instead of using standard clipart.
Claude Jones, Director of Engineer, @Walmartlabs, USA
I needed a fresh look at some of my slides. I've tried to find a way to create a paintbrush effect, to underline, accentuate, add some color and the handwritten markers were just the things. Very easy to use, easy to size, change the color. It was an affordable, perfect solution and I'm happy to recommend it.
Anonymous, US
The crisp, clean look of the graphics, and the fact that it allowed me to easily edit and change the colors to match the template was my main reason for purchasing them.
Brandie Jenkins, E-learning Developer, USA
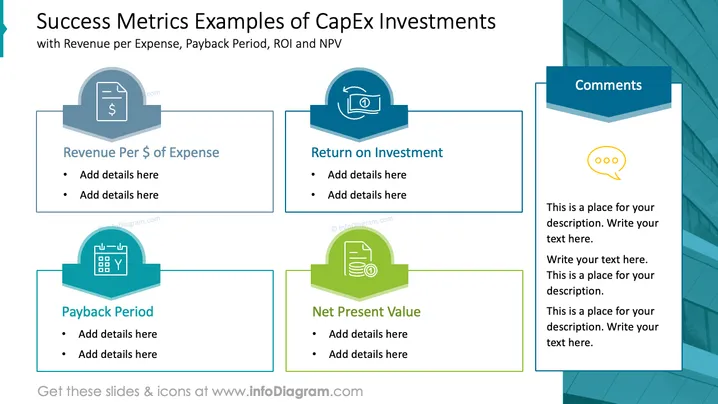
The slide is titled "Success Metrics Examples of CapEx Investments" and presents four different financial concepts: Revenue per Expense, Return on Investment (ROI), Payback Period, and Net Present Value (NPV). Each concept is associated with an icon and two bullet points for additional details. Revenue per Expense may involve measuring the efficiency of spending, ROI quantifies the gain from investments, Payback Period calculates how long it takes to recoup an investment, and NPV assesses the profitability of a project by considering the time value of money.
The slide has a clean and professional layout with logically structured information blocks for easy readability. The use of icons corresponding to each financial concept provides visual cues to aid in the viewer's comprehension.




