

Your graphics add a nice touch to my presentations and I recently used them for one of my all-hands meetings. Your toolbox adds professionalism to my slides. Instead of using standard clipart.
Claude Jones, Director of Engineer, @Walmartlabs, USA

Your graphics add a nice touch to my presentations and I recently used them for one of my all-hands meetings. Your toolbox adds professionalism to my slides. Instead of using standard clipart.
Claude Jones, Director of Engineer, @Walmartlabs, USA
I needed a fresh look at some of my slides. I've tried to find a way to create a paintbrush effect, to underline, accentuate, add some color and the handwritten markers were just the things. Very easy to use, easy to size, change the color. It was an affordable, perfect solution and I'm happy to recommend it.
Anonymous, US
The crisp, clean look of the graphics, and the fact that it allowed me to easily edit and change the colors to match the template was my main reason for purchasing them.
Brandie Jenkins, E-learning Developer, USA
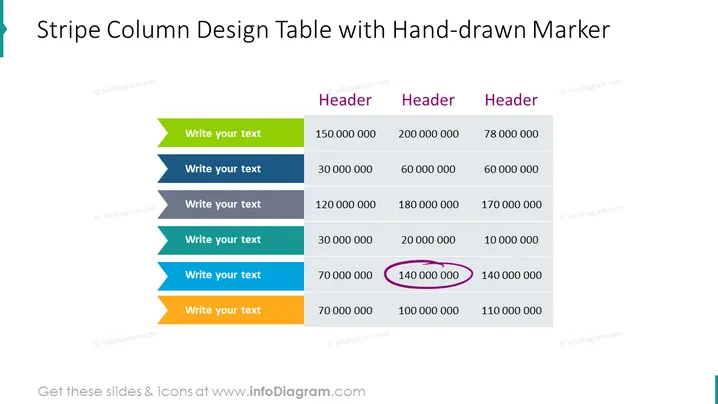
The slide appears to be a template for presenting data in a table format with an emphasis on comparison across different categories or time periods. Each row is associated with a "Write your text" placeholder, suggesting that the user can input their own descriptions or titles for each row. Each column is headed by "Header," which can be customized to represent different data sets or categories for comparison. The table includes numerical data, with some numbers circled by a hand-drawn marker to highlight them, signifying their importance or deviation.
The overall look of the slide is modern and minimalistic, with a clear emphasis on readability and contrast between elements to allow for easy comparison of data.



