

Your graphics add a nice touch to my presentations and I recently used them for one of my all-hands meetings. Your toolbox adds professionalism to my slides. Instead of using standard clipart.
Claude Jones, Director of Engineer, @Walmartlabs, USA

Your graphics add a nice touch to my presentations and I recently used them for one of my all-hands meetings. Your toolbox adds professionalism to my slides. Instead of using standard clipart.
Claude Jones, Director of Engineer, @Walmartlabs, USA
I needed a fresh look at some of my slides. I've tried to find a way to create a paintbrush effect, to underline, accentuate, add some color and the handwritten markers were just the things. Very easy to use, easy to size, change the color. It was an affordable, perfect solution and I'm happy to recommend it.
Anonymous, US
The crisp, clean look of the graphics, and the fact that it allowed me to easily edit and change the colors to match the template was my main reason for purchasing them.
Brandie Jenkins, E-learning Developer, USA
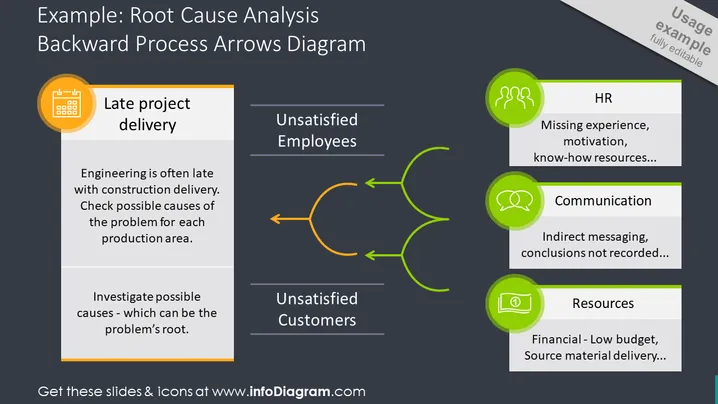
The PowerPoint slide titled "Example: Root Cause Analysis Backward Process Arrows Diagram" presents a method for identifying the root causes of a problem in a project or process. The slide outlines an issue of "Late project delivery" and highlights two core consequent effects: "Unsatisfied Employees" and "Unsatisfied Customers." Each effect is linked to potential root causes labeled as HR, Communication, and Resources. The HR issue involves missing experience and motivation, Communication addresses indirect messaging, and Resources pertain to financial constraints and source material delivery challenges. All these elements are interconnected by backward pointing arrows signifying the investigation process from effects to causes.
The slide is neatly organized, with a clean and professional look, using a consistent color scheme of orange, green, white, and grey, to maintain visual coherence and direct attention to key parts of the process.



