

Your graphics add a nice touch to my presentations and I recently used them for one of my all-hands meetings. Your toolbox adds professionalism to my slides. Instead of using standard clipart.
Claude Jones, Director of Engineer, @Walmartlabs, USA

Your graphics add a nice touch to my presentations and I recently used them for one of my all-hands meetings. Your toolbox adds professionalism to my slides. Instead of using standard clipart.
Claude Jones, Director of Engineer, @Walmartlabs, USA
I needed a fresh look at some of my slides. I've tried to find a way to create a paintbrush effect, to underline, accentuate, add some color and the handwritten markers were just the things. Very easy to use, easy to size, change the color. It was an affordable, perfect solution and I'm happy to recommend it.
Anonymous, US
The crisp, clean look of the graphics, and the fact that it allowed me to easily edit and change the colors to match the template was my main reason for purchasing them.
Brandie Jenkins, E-learning Developer, USA
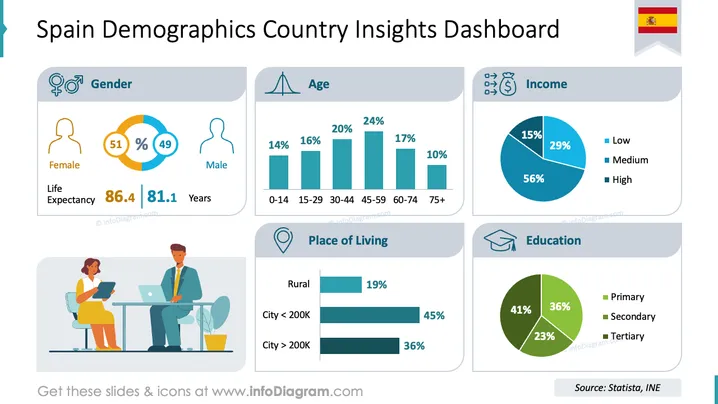
This slide presents an overview of demographics in Spain, highlighting key statistics across gender, age, income, place of living, and education. Gender: The population is nearly balanced, with females at 51% and males at 49%, with life expectancy at 86.4 years for females and 81.1 years for males. Age: Age distribution shows varied representation, with 0-14 at 14%, 15-29 at 16%, 30-44 at 20%, 45-59 at 24%, 60-74 at 17%, and 75+ at 10%. Income: Income levels depict 15% low, 29% medium, and 56% high income. Place of Living: Residential distribution indicates 19% living in rural areas, 45% in cities under 200K, and 36% in larger cities. Education: Educational attainment includes 36% in primary, 41% in secondary, and 23% in tertiary education.
The overall slide presents a professional and visually engaging composition, using consistent color schemes and icons to facilitate easy comprehension. The combination of pie charts, bar charts, and icons enhances data visualization.
Present ### Use Cases
Presenting demographic insights to stakeholders for market analysis.
Educational seminars focused on population studies and trends.
Business strategy meetings to understand consumer demographics.
Government policy planning sessions regarding societal needs.



