
Your graphics add a nice touch to my presentations and I recently used them for one of my all-hands meetings. Your toolbox adds professionalism to my slides. Instead of using standard clipart.
Claude Jones, Director of Engineer, @Walmartlabs, USA

Your graphics add a nice touch to my presentations and I recently used them for one of my all-hands meetings. Your toolbox adds professionalism to my slides. Instead of using standard clipart.
Claude Jones, Director of Engineer, @Walmartlabs, USA

I needed a fresh look at some of my slides. I've tried to find a way to create a paintbrush effect, to underline, accentuate, add some color and the handwritten markers were just the things. Very easy to use, easy to size, change the color. It was an affordable, perfect solution and I'm happy to recommend it.
Anonymous, US
The crisp, clean look of the graphics, and the fact that it allowed me to easily edit and change the colors to match the template was my main reason for purchasing them.
Brandie Jenkins, E-learning Developer, USA
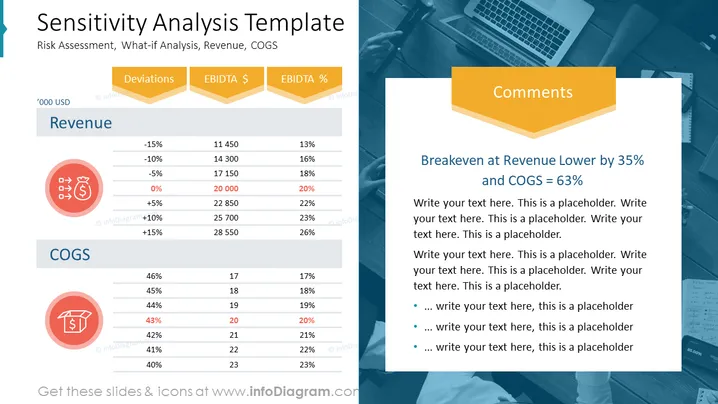
The slide titled "Sensitivity Analysis Template" discusses risk assessment and what-if analysis, focusing on revenue and COGS (Cost of Goods Sold). It features two main sections of data: "Revenue" with potential deviations from -15% to +15% and the corresponding EBITDA ($) and EBITDA (%) for each deviation; "COGS" with percentages from 40% to 46% and the associated values in '000 USD. Below each section, there are illustrative icons. A "Comments" section outlines a specific scenario, breakeven at Revenue Lower by 35% and COGS of 63%.
The slide has a professional and streamlined design with a clear focus on financial data. The use of icons and color highlights draws attention to key elements without overwhelming the viewer.


