

Your graphics add a nice touch to my presentations and I recently used them for one of my all-hands meetings. Your toolbox adds professionalism to my slides. Instead of using standard clipart.
Claude Jones, Director of Engineer, @Walmartlabs, USA

Your graphics add a nice touch to my presentations and I recently used them for one of my all-hands meetings. Your toolbox adds professionalism to my slides. Instead of using standard clipart.
Claude Jones, Director of Engineer, @Walmartlabs, USA
I needed a fresh look at some of my slides. I've tried to find a way to create a paintbrush effect, to underline, accentuate, add some color and the handwritten markers were just the things. Very easy to use, easy to size, change the color. It was an affordable, perfect solution and I'm happy to recommend it.
Anonymous, US
The crisp, clean look of the graphics, and the fact that it allowed me to easily edit and change the colors to match the template was my main reason for purchasing them.
Brandie Jenkins, E-learning Developer, USA
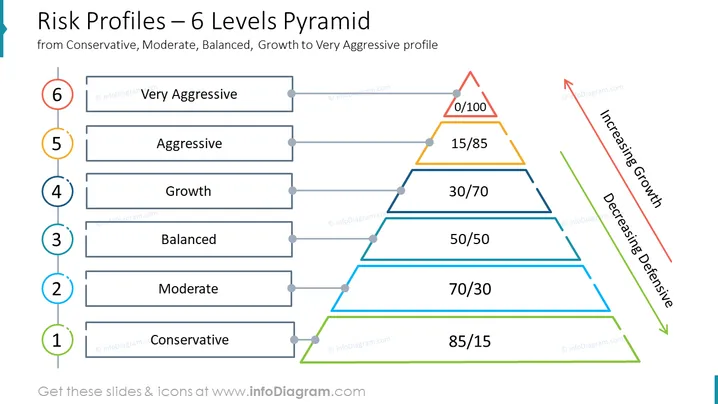
This PowerPoint slide effectively illustrates the concept of risk profiles using a six-level pyramid structure. The pyramid categorizes investor profiles into six distinct levels: Conservative, Moderate, Balanced, Growth, Aggressive, and Very Aggressive. Each level is represented by a segment of the pyramid, with the Conservative profile at the base and the Very Aggressive profile at the apex. The slide also includes a percentage scale indicating the allocation between defensive and growth assets for each risk profile. This infographic slide can be used in various business presentations, particularly those related to investment strategies, financial planning, and risk management. It provides a clear and concise visual representation of the different risk profiles, allowing audiences to easily grasp the concept and its implications for investment decisions.



