

Your graphics add a nice touch to my presentations and I recently used them for one of my all-hands meetings. Your toolbox adds professionalism to my slides. Instead of using standard clipart.
Claude Jones, Director of Engineer, @Walmartlabs, USA

Your graphics add a nice touch to my presentations and I recently used them for one of my all-hands meetings. Your toolbox adds professionalism to my slides. Instead of using standard clipart.
Claude Jones, Director of Engineer, @Walmartlabs, USA
I needed a fresh look at some of my slides. I've tried to find a way to create a paintbrush effect, to underline, accentuate, add some color and the handwritten markers were just the things. Very easy to use, easy to size, change the color. It was an affordable, perfect solution and I'm happy to recommend it.
Anonymous, US
The crisp, clean look of the graphics, and the fact that it allowed me to easily edit and change the colors to match the template was my main reason for purchasing them.
Brandie Jenkins, E-learning Developer, USA
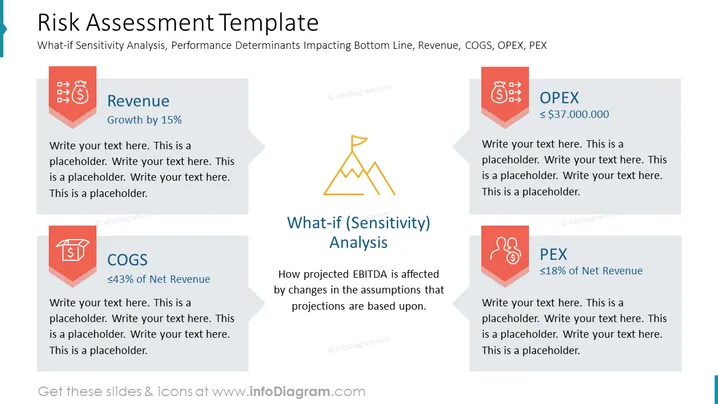
The slide is titled "Risk Assessment Template" and deals with What-if Sensitivity Analysis, identifying performance determinants that impact the bottom line, including Revenue, COGS (Cost of Goods Sold), OPEX (Operational Expenditure), and PEX (Planned Expenditure). It features four key areas: Revenue with a target for 15% growth, COGS which should be less than 43% of net revenue, OPEX with an amount of less than or equal to $37,000,000, and PEX which should be less than 18% of net revenue. The central graphic is about What-if (Sensitivity) Analysis, explaining how projected EBITDA is affected by changes in assumptions.
The slide has a symmetrical design with icons and text boxes that are mirrored on each side, giving it a balanced and organized appearance. The use of distinct colors and bold icons creates an engaging and professional visual effect.



