
Your graphics add a nice touch to my presentations and I recently used them for one of my all-hands meetings. Your toolbox adds professionalism to my slides. Instead of using standard clipart.
Claude Jones, Director of Engineer, @Walmartlabs, USA

Your graphics add a nice touch to my presentations and I recently used them for one of my all-hands meetings. Your toolbox adds professionalism to my slides. Instead of using standard clipart.
Claude Jones, Director of Engineer, @Walmartlabs, USA

I needed a fresh look at some of my slides. I've tried to find a way to create a paintbrush effect, to underline, accentuate, add some color and the handwritten markers were just the things. Very easy to use, easy to size, change the color. It was an affordable, perfect solution and I'm happy to recommend it.
Anonymous, US
The crisp, clean look of the graphics, and the fact that it allowed me to easily edit and change the colors to match the template was my main reason for purchasing them.
Brandie Jenkins, E-learning Developer, USA
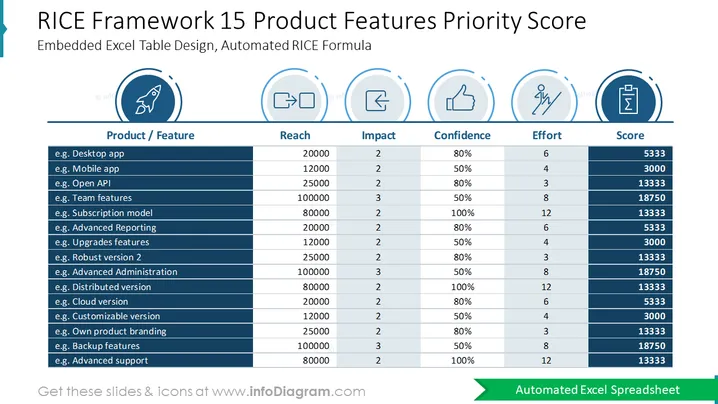
The slide showcases a RICE scoring model used for prioritizing product features. RICE stands for Reach, Impact, Confidence, and Effort, which are different metrics used to assess each feature's potential and required resources. Example features listed include "Desktop app," "Mobile app," and "Open API," among others. Each feature is evaluated based on estimated reach, impact level, confidence percentage, the effort required, and a final prioritization score, with higher scores indicating higher priority.
The slide presents a clean and professional appearance, employing a consistent blue color palette that enhances readability and emphasizes the data. Icons and gradient shading are used effectively to draw attention to key elements of the scoring model.


