

Your graphics add a nice touch to my presentations and I recently used them for one of my all-hands meetings. Your toolbox adds professionalism to my slides. Instead of using standard clipart.
Claude Jones, Director of Engineer, @Walmartlabs, USA

Your graphics add a nice touch to my presentations and I recently used them for one of my all-hands meetings. Your toolbox adds professionalism to my slides. Instead of using standard clipart.
Claude Jones, Director of Engineer, @Walmartlabs, USA
I needed a fresh look at some of my slides. I've tried to find a way to create a paintbrush effect, to underline, accentuate, add some color and the handwritten markers were just the things. Very easy to use, easy to size, change the color. It was an affordable, perfect solution and I'm happy to recommend it.
Anonymous, US
The crisp, clean look of the graphics, and the fact that it allowed me to easily edit and change the colors to match the template was my main reason for purchasing them.
Brandie Jenkins, E-learning Developer, USA
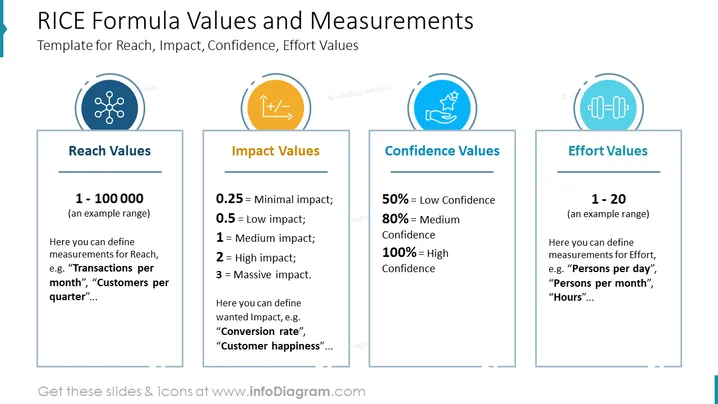
This slide presents the RICE formula for prioritization, by explaining the values and measurements of each of the RICE segments. For example, in the reach values, you can measure the score 1-100 000, like transactions per month, customers per quarter, etc. In the impact value, you can measure the score as 0.25 as a minimal impact, 0.5. low impact, 1 for minimum impact, 2 - for high impact, and 3 - for massive impact. You can use this metric to measure conversion rate, customer happiness, etc. In the confidence values, 50% would stand for low confidence, 80% for medium confidence, and 100% - for high confidence. The effort values could be measured with an example range of 1-20 (persons per day, persons per month, hours, etc).
##Slide infographic description:
Rectangular Text Blocks, Line Vectors, Flat Outline Circle Icon, Molecule Icon, Hand Holding Stars Icon, Dumbbell Icon, Math Icon



