

Your graphics add a nice touch to my presentations and I recently used them for one of my all-hands meetings. Your toolbox adds professionalism to my slides. Instead of using standard clipart.
Claude Jones, Director of Engineer, @Walmartlabs, USA

Your graphics add a nice touch to my presentations and I recently used them for one of my all-hands meetings. Your toolbox adds professionalism to my slides. Instead of using standard clipart.
Claude Jones, Director of Engineer, @Walmartlabs, USA
I needed a fresh look at some of my slides. I've tried to find a way to create a paintbrush effect, to underline, accentuate, add some color and the handwritten markers were just the things. Very easy to use, easy to size, change the color. It was an affordable, perfect solution and I'm happy to recommend it.
Anonymous, US
The crisp, clean look of the graphics, and the fact that it allowed me to easily edit and change the colors to match the template was my main reason for purchasing them.
Brandie Jenkins, E-learning Developer, USA
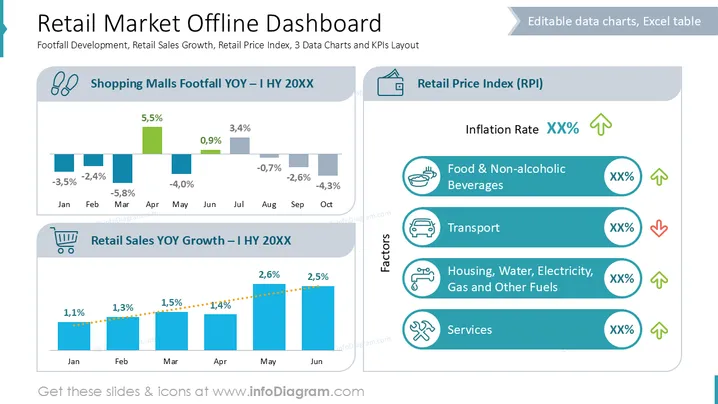
The slide presents a comprehensive overview of the retail market metrics, focusing on footfall development, retail sales growth, and the retail price index. The "Shopping Malls Footfall YOY – I HY 20XX" chart displays fluctuating percentages of foot traffic changes for each month, while "Retail Sales YOY Growth – I HY 20XX" illustrates positive growth trends in sales. The "Retail Price Index (RPI)" section shows the inflation rate and specific factors like "Food & Non-alcoholic Beverages" and "Transport," with their respective percentage changes indicated.
The slide background is primarily white with a clean and professional layout.
There are three main sections: two horizontal bar charts on the left and a vertical list on the right.
The top-left chart features bars in blue and green with percentage values above each bar, depicting monthly changes in footfall.
The bottom-left chart has blue bars, displaying consistent retail sales growth percentages.
The right section lists factors influencing the Retail Price Index with icons like a bowl for food and a car for transport, accompanied by arrows indicating changes.
The design incorporates icons, neat alignments, and varied font sizes to distinguish headings, categories, and data efficiently.
The slide employs a structured layout that is easy to comprehend, combining textual data with visual representations effectively for a professional presentation context.
Usage in quarterly or annual retail performance reviews.
Suitable for presentations discussing market trends and economic analysis with stakeholders.
Useful for outlining strategic planning sessions focused on retail growth and inflation impacts.
Ideal for briefing financial analysts on consumer trends and price index shifts.



