

Your graphics add a nice touch to my presentations and I recently used them for one of my all-hands meetings. Your toolbox adds professionalism to my slides. Instead of using standard clipart.
Claude Jones, Director of Engineer, @Walmartlabs, USA

Your graphics add a nice touch to my presentations and I recently used them for one of my all-hands meetings. Your toolbox adds professionalism to my slides. Instead of using standard clipart.
Claude Jones, Director of Engineer, @Walmartlabs, USA
I needed a fresh look at some of my slides. I've tried to find a way to create a paintbrush effect, to underline, accentuate, add some color and the handwritten markers were just the things. Very easy to use, easy to size, change the color. It was an affordable, perfect solution and I'm happy to recommend it.
Anonymous, US
The crisp, clean look of the graphics, and the fact that it allowed me to easily edit and change the colors to match the template was my main reason for purchasing them.
Brandie Jenkins, E-learning Developer, USA
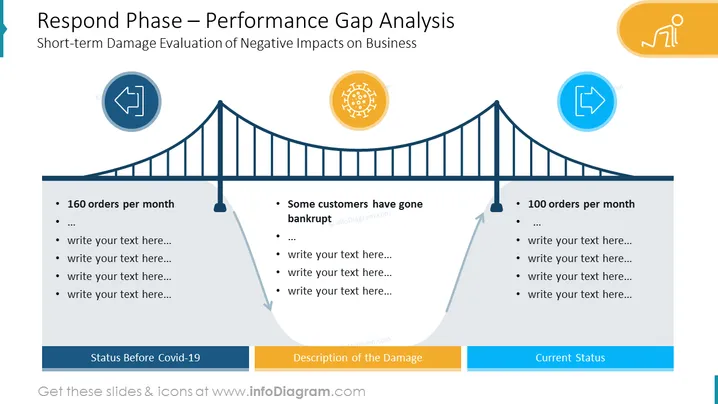
Short-term Damage Evaluation of Negative Impacts on Business
The slide is titled "Respond Phase – Performance Gap Analysis" with a subtitle "Short-term Damage Evaluation of Negative Impacts on Business." It presents a visual metaphor of a bridge indicating a performance gap, with three stages: "Status Before Covid-19," "Description of the Damage," and "Current Status." The bridge shows a downward trend as it moves from the left to the center, and an upward trend towards the right side, suggesting a recovery. The first stage lists "160 orders per month," while the middle stage notes "Some customers have gone bankrupt," and the last stage shows "100 orders per month." Each stage has additional bullet points for customizable text.
The slide employs a simplistic yet effective design, utilizing icons and color coding to illustrate the past, impact, and current status of a business. The bridge metaphor effectively conveys the idea of crossing over a performance gap.



